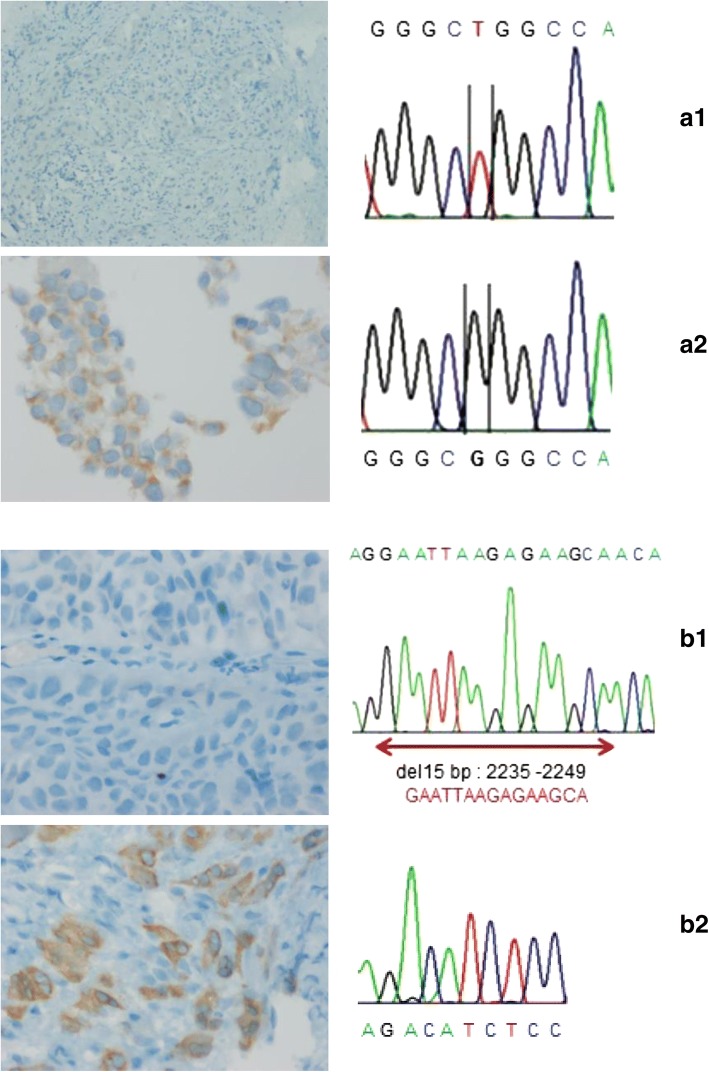
Fig. 3.
Concordance analysis IHC and DNA sequencing: L858R: a1 (Patient 7): Left -- > negative IHC (Original magnification, 10×) / Right -- > normal electropherogram. a2 (Patient 19): Left -- > positive IHC (Original magnification, 40×) Right -- > 2573 T > G point mutation in exon 21. E746-A750: b1 (Patient 44): Left -- > negative IHC (Original magnification, 40×) Right -- > normal electropherogram. b2 (Patient 33): Left -- > positive IHC (Original magnification, 40×) / Right -- > 2235–2249 del 15 bp

