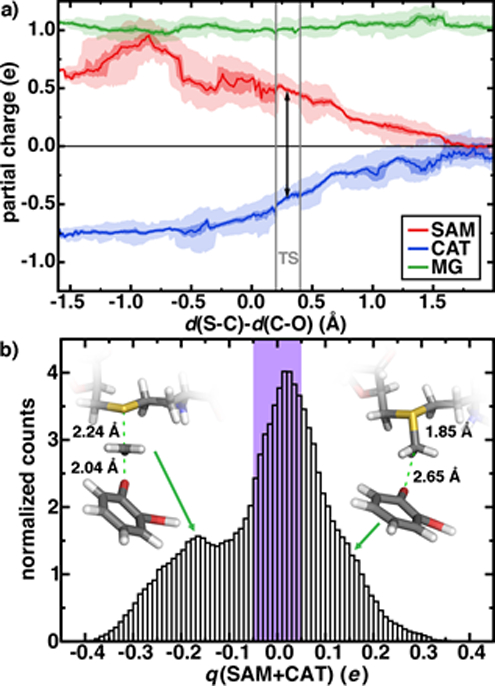
Figure 3.

a) Sum of charges on SAM (red), CAT (blue), and Mg2+ (green) during methyl transfer reaction in the M5 QM/MM model. Over 0.01 Å bins of simulation data, average charges are indicated by lines, the first to third interquartile range is indicated by the darker shaded region and the full range of charges are indicated by light shading. The methyl charge is partitioned between substrates as described in the main text, and the TS region is indicated as gray vertical bars with average charge separation shown as a black arrow. b) Normalized histogram of partial charges summed over SAM and CAT (in e) across 200 ps of aggregated M5 free energy simulation. The purple bars represent ±0.05 e range and each bin is 0.01 e wide.
