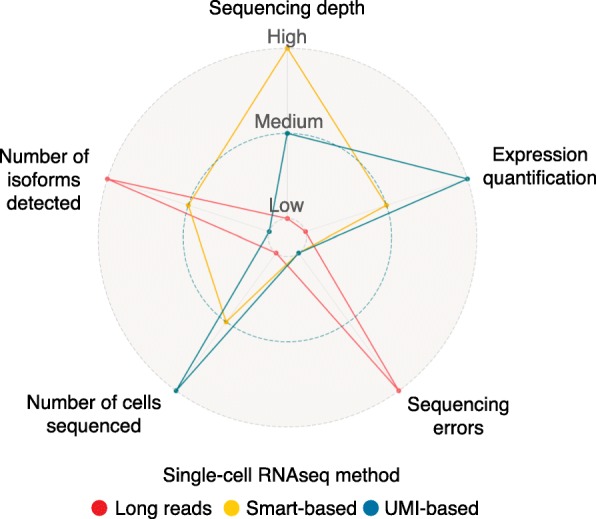
Fig. 3.

Qualitative performance comparison of the three main single-cell RNAseq methods for isoform detection. From the inside to the outside of the graph, the three dotted lines represent ‘low’, ‘medium’ and ‘high’ levels of each characteristic. The most prominent features of long reads (red) are high isoform resolution potential but a high occurrence of errors. Smart-based methods (yellow) provide high sequencing depth and medium isoform resolution power and number of cells. UMI-based methods (blue) can process high numbers of cells with medium to low sequencing depth and accurately quantify isoform expression, although their isoform resolution potential is strongly limited. UMI unique molecular identifier
