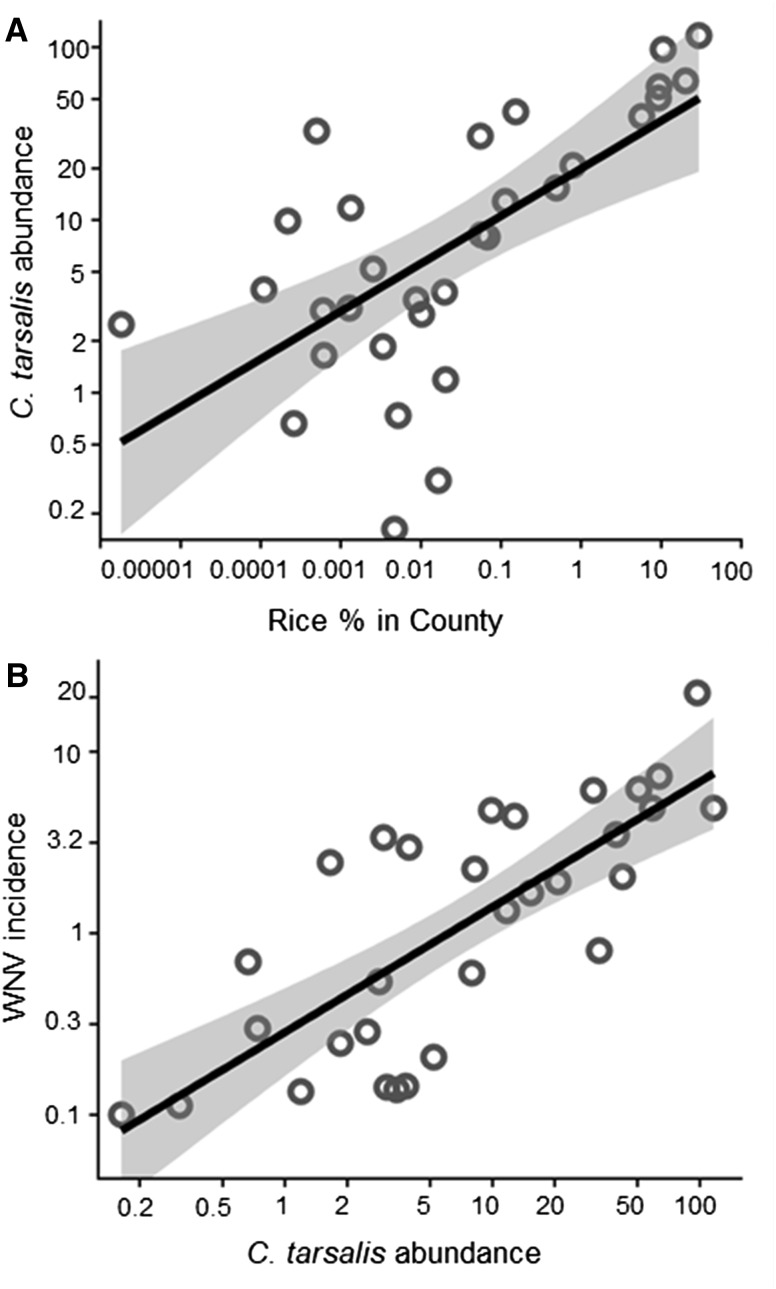
Figure 4.
Rice cover, Culex tarsalis mosquito abundance, and human West Nile virus (WNV) incidence. (A) C. tarsalis abundance (New Jersey light trap mosquitoes per trap-week) in California between June and September, over the period 2000–2015 plotted against the percent rice cover in each county: Log10 C. tarsalis abundance = 1.30 + 0.28 (±SE = 0.06) × Log10 percent rice cultivation; N = 31, R2 = 0.44, general least squares model including spatial autocorrelation, P = 0.0004. (B) Average yearly human WNV incidence per 100,000 people (2004–2014) plotted against C. tarsalis abundance in each county: Log10 WNV incidence = −0.54 + 0.69 (±SE = 0.11) × Log10 C. tarsalis abundance; N = 31, R2 = 0.59, general least squares model including spatial autocorrelation, P = 0.0002. For panel (B), counties with no WNV cases are shown with an incidence of 0.1.

