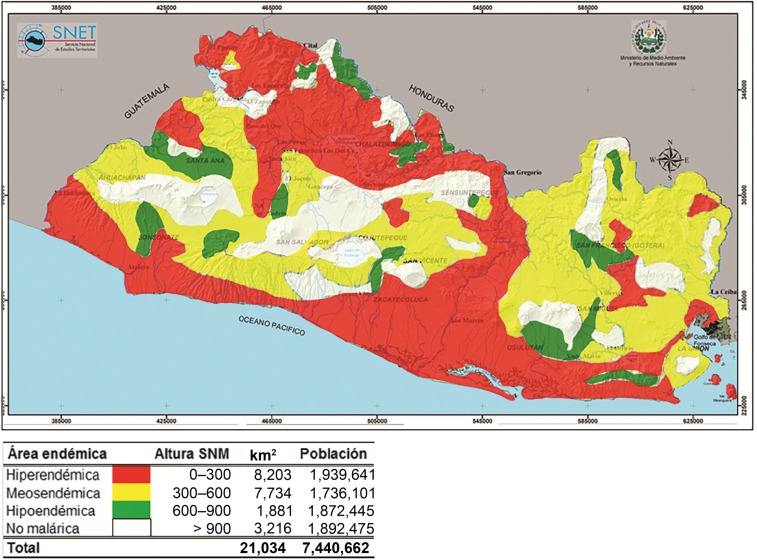
Figure 3.
Topographical map of El Salvador detailing the results of the malaria epidemiological stratification (National Vector Control Program, personal communication). Regions of hyperendemicity (hiperendémica), moderate endemicity (mesoendémica), and hypoendemicity (hipoendémica) are shown in red, yellow, and green, respectively. Areas with no malaria endemicity (no malárica) are shown in white. The altitude above sea level (altura sobre el nivel del mar [SNM]), total land area in km2, and population (población) of each region are also indicated in the key below the figure.

