FIGURE 2:
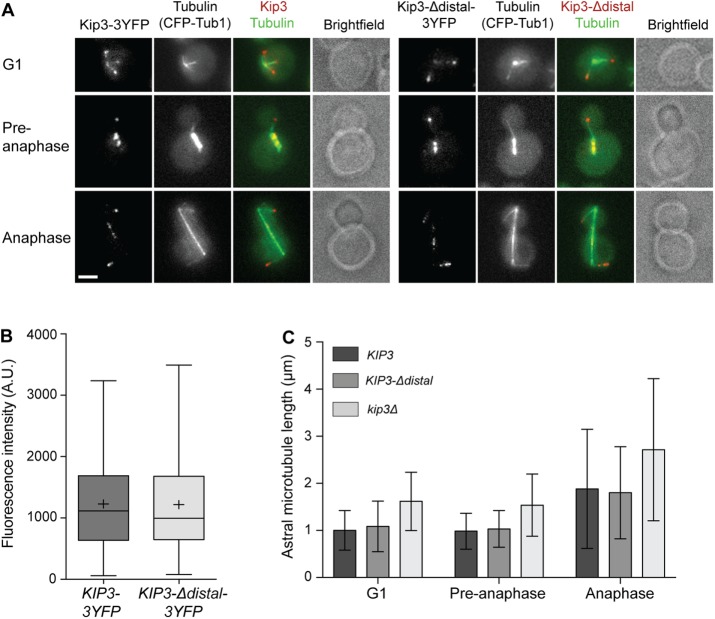
Effect of the Kip3 tail on localization and regulation of astral MT length. (A) Kip3 (left) and Kip3-Δdistal (right) localize similarly as prominent foci at the plus ends of astral MTs and to preanaphase and anaphase spindles. Representative images of cells expressing CFP-tubulin and YFP-labeled Kip3 or Kip3-Δdistal are shown. (B) Amount of Kip3-3YFP and Kip3-Δdistal-3YFP on MT plus ends in G1 cells. Center line is median, boxes represent the 25th to 75th percentiles, and whiskers encompass from 2.5 to 97.5 percentiles; (+) represents mean values. (C) Astral MT length in G1, preanaphase, and anaphase cells of the indicated genotype. For kip3Δ, p < 0.001 vs. KIP3 and KIP3-Δdistal at all stages. KIP3 vs. KIP3-Δdistal are not statistically significant. Mean ± SD. (A) Bar, 2 μm; (B) n = 118 for Kip3-3YFP and 111 for Kip3-Δdistal-3YFP; (C) n > 150 MTs for each cell type in each category.

