FIGURE 6:
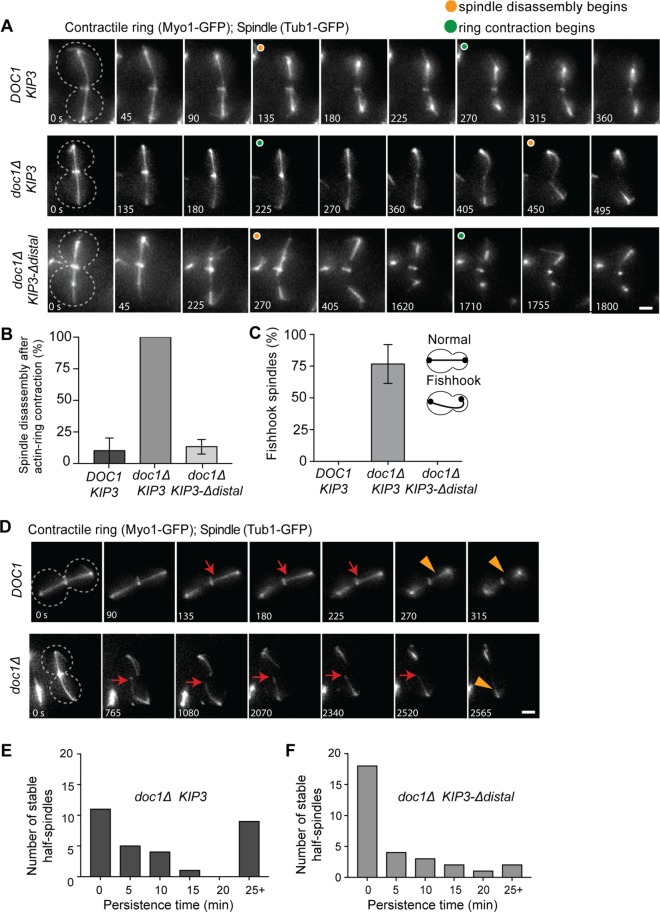
The distal tail region of Kip3 prevents spindle midzone destabilization. (A) Time-lapse images of the spindle (GFP-Tubulin) and actinomyosin ring (Myo1-GFP) during late anaphase/mitotic exit in control (DOC1 KIP3), doc1Δ KIP3, and doc1Δ KIP3-Δdistal cells. Cell outline indicated by dotted line, and orange and green circles denote when spindle breakdown and actinomyosin ring contraction begins, respectively. In doc1Δ cells spindle breakdown is delayed and the actinomyosin ring closes on the intact spindle. (B) Percentage of spindles that break down after actinomyosin ring contraction in cells of the indicated genotype. (C) Fishhook spindles in each genotype. For B and C p < 0.0001 for doc1Δ KIP3 vs. either cell type; mean ± SD. (D) Time-lapse images of DOC1 and doc1Δ cells expressing GFP-tubulin and Myo1-GFP during anaphase spindle breakdown. Cell outline is indicated by a dotted line; red arrows denote stable half-spindles, and orange arrowheads denote depolymerizing half-spindle. Note that the half-spindle in the doc1Δ cell is hyperstable. (E, F) Histograms showing the persistence time of hyperstable half-spindles in E doc1Δ KIP3 and (F) doc1Δ KIP3-Δdistal cells during spindle breakdown. p < 0.05 for doc1Δ KIP3 vs. doc1Δ KIP3-Δdistal. (B, C, E, F) n = 30 for each genotype, with 10 spindles observed in each of three experiments; (E, F) the half-spindle with the longest persistence time for each spindle is reported.

