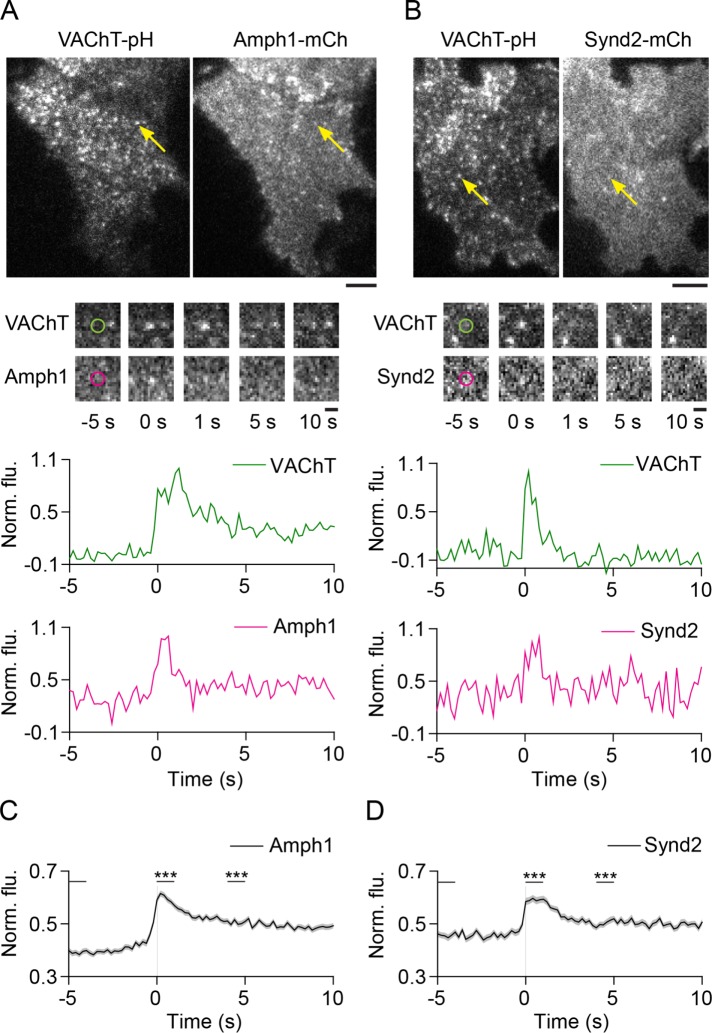
FIGURE 5:
Amphiphysin1 and syndapin2 are transiently recruited to SLMV fusion sites. (A, B) Images of PC12 cells expressing (A) VAChT-pH and amphiphysin1-mCherry or (B) VAChT-pH and syndapin2-mCherry. Arrowheads show fusion events in the green channel and the corresponding regions in the red channel, after application of stimulation buffer. Bar, 5 μm. Middle, snapshots of the fusion event shown above at the indicated time points. Time-point “0 s” indicates the first frame of brightening in the green channel. Bar, 1 μm. Bottom, time-lapse traces of normalized fluorescence intensities in the green and red channels for the fusion event shown above. (C, D) Average time-lapse traces of normalized fluorescence intensities in the red channel for (C) Amph1-WT (371 events, nine cells) and (D) Synd2-WT (228 events, six cells). Individual event traces were time-aligned to 0 s (vertical black line), which corresponds to the fusion frame in the green channel. Standard errors are plotted as shaded areas around the average traces. ***p ≤ 0.0001 when compared with baseline.

