Figure 3.
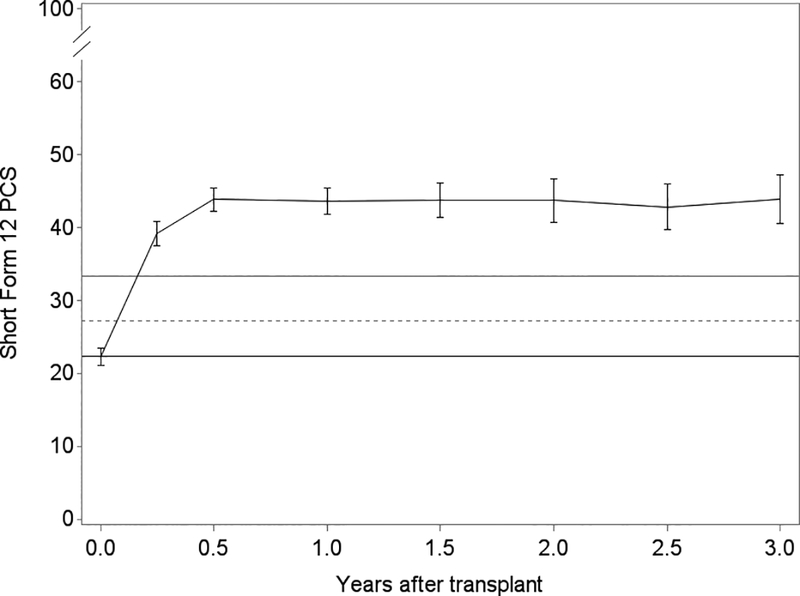
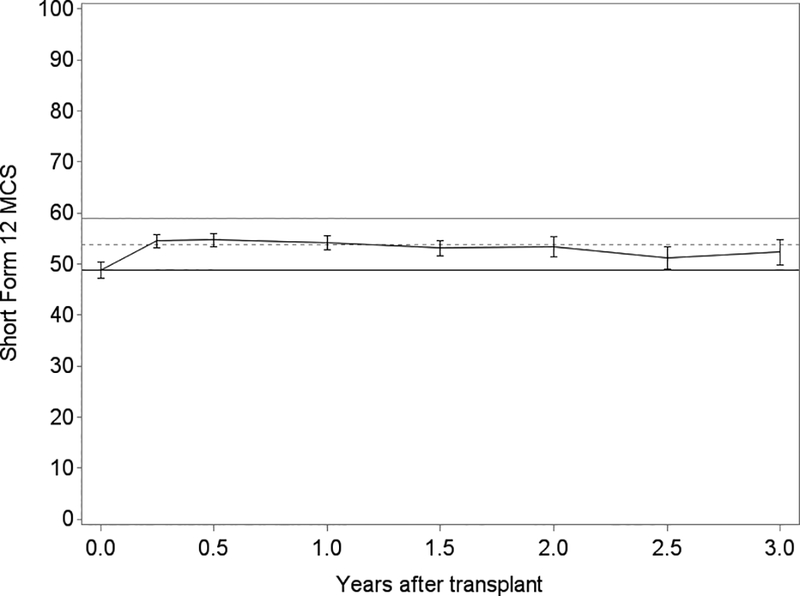
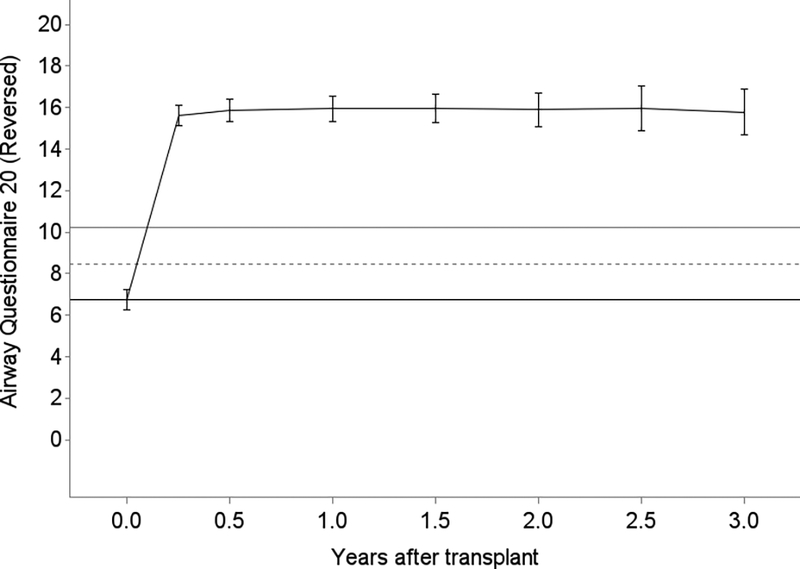
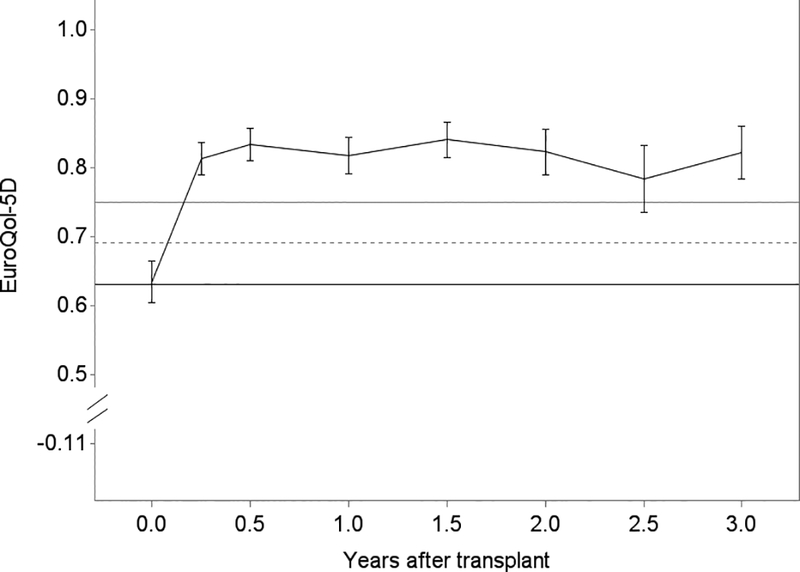
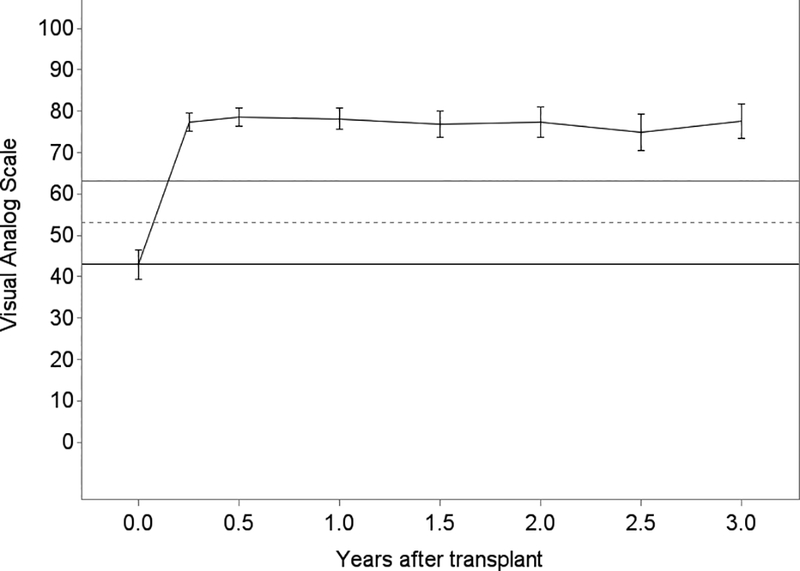
Unadjusted plots of average health-related quality of life (HRQL) from before transplant to up to 3 years after lung transplantation for Panel A. SF12 Physical Component Summary (PCS); Panel B. SF12 Mental Component Summary (MCS); Panel C. Airway Questionnaire 20-revised; Panel D. Euroqol 5D; and Panel E. Euroqol Visual Analog Scale. The plotted line reflects the mean score and whisker bars reflect the bounds of the 95% confidence intervals at each time point. On the Y-axis, the first solid horizontal line marks the baseline mean; the dashed horizontal line reflects the minimally clinically important difference (MCID) and the solid line reflects twice the MCID. The number of subjects who contributed HRQL data, missed survey responses, and died at each time point is shown in Table S1.
