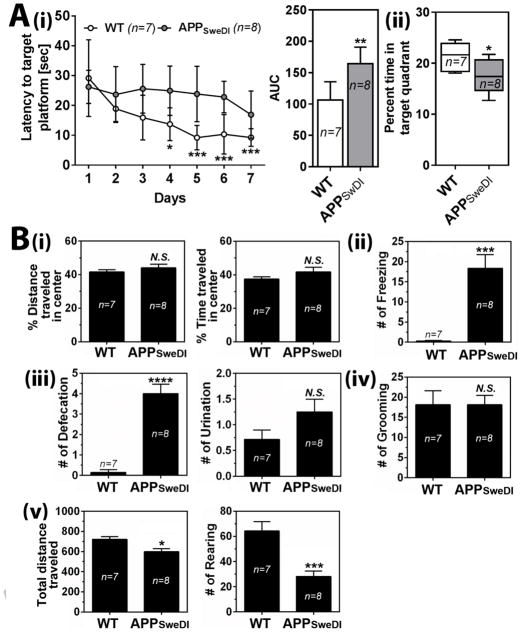
Fig. 2. Cognitive deficits and neuropsychiatric-like symptoms in APPSwDI mice (6 months old).
A. Spatial learning (latency to invisible target platform) and memory (% time to spent in target quadrant without platform) functions were analyzed by Morris water maze test. In left panel of A-i, open (WT mice) and solid (APPSwDI mice) circles represent mean and T-bars represent standard error means. In right panel of A-i, the area under the curve (AUC) of the overall learning was calculated and represented by bar graph. In panel A-ii, columns show 75% of distribution; horizontal bar in each column is median; and vertical T-bars are minimum and maximum values of the data. B. Open field test was test for anxiety-like behaviors, such as distance/time travelled in the center area (i), number of freezing (ii), number of defecation and urination (iii), number of grooming (iv), and total travelled distance and number of rearing (v). All columns are means of individual data and T-bars are standard error mean: n.s. P > 0.05. *. P ≤ 0.05. **. P ≤ 0.01. ***. P ≤0.001. ****. P ≤ 0.0001 as compared to WT mice.

