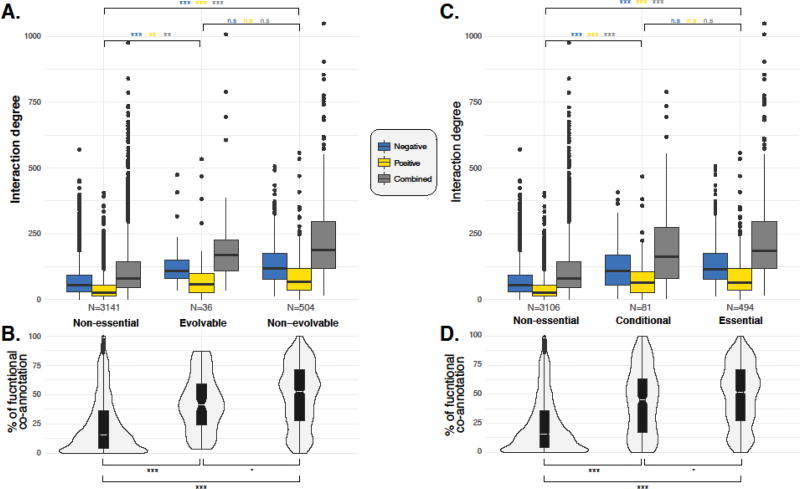
Figure 1. Genetic interaction degree and functional co-annotation of interacting genes.
The number of genetic interactions observed for non-essential, evolvable and non-evolvable gene categories (A) and non-essential, conditional and essential gene categories (C) are shown in boxplots. The types of interaction are color-coded and the numbers of observations are indicated at the bottom of each plot. For each gene category, the corresponding functional co-annotation rate and distribution are presented (B and D). One-tailed t-test has been performed for all pairwise comparison between assigned gene categories and percentages of functional co-annotation. The significance levels are indicated on the graph. Significance levels: n.s (p-value > 0.1), • (0.05 < p-value < 0.1), * (0.005 < p-value < 0.05), ** (0.0005 < p-value < 0.005), *** (p-value < 0.0005). Data compiled from [31, 35].

