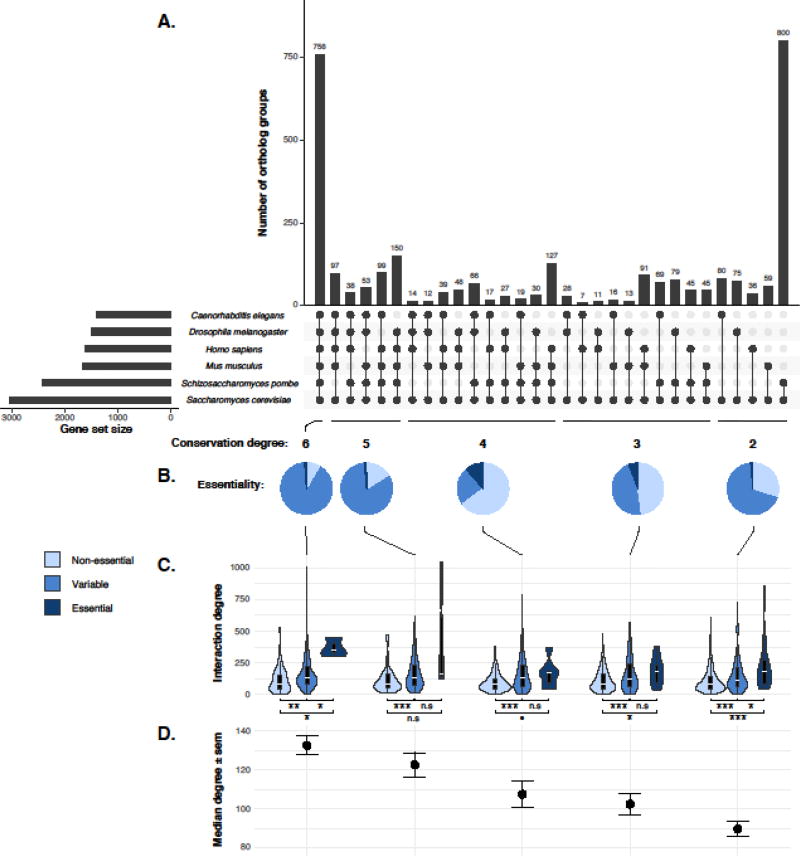
Figure 2. The impact of genetic network complexity on the evolution of gene essentiality in orthologs across six distantly related species.
A. Ortholog conservations across six species. A list of 3408 S. cerevisiae genes and their orthologs from human (Homo sapiens), mouse (Mus musculus), fly (Drosophila melanogaster), worm (Caenorhabditis elegans) and fission yeast (Schizosaccharomyces pombe) was compiled from the InParanoid database [47]. The gene set sizes correspond to the number of orthologs found per species and are indicated on the left side of the plot. The intersections among different species are shown by connective dots, which is ranked by the number of shared species (conservation degree). The number of orthologs within each intersection is indicated as bar plot at the top panel. B. Pie chart distribution of gene essentiality within each degree of ortholog conservation groups. Gene essentiality for each ortholog from each of the species examined was obtained from the OGEE database [48]. Genes that are consistently non-essential across different species are annotated as “Non-essential” for the entire ortholog group and is color-coded as light blue. Genes that are consistently essential are annotated as “Essential” (dark blue) and genes display variable essentialities across different species are annotated as “Variable” (blue). C. Combined genetic interaction degree observed in S. cerevisiae [31] relative to the degree of conservation and gene essentiality annotations. Interaction degree data were available for 1994/3408 yeast orthologs. For each degree of conservation, one-tailed t-test has been performed for all pairwise comparison between “Non-essential”, “Variable” and “Essential” qualifiers. The significance levels are indicated on the graph. Significance levels: n.s (p-value > 0.1), • (0.05 < p-value < 0.1), * (0.005 < p-value < 0.05), ** (0.0005 < p-value < 0.005), *** (p-value < 0.0005). D. Median interaction degree observed in each group of conservation degree. Error-bars indicate the standard error. All data can be found in Table S2.

