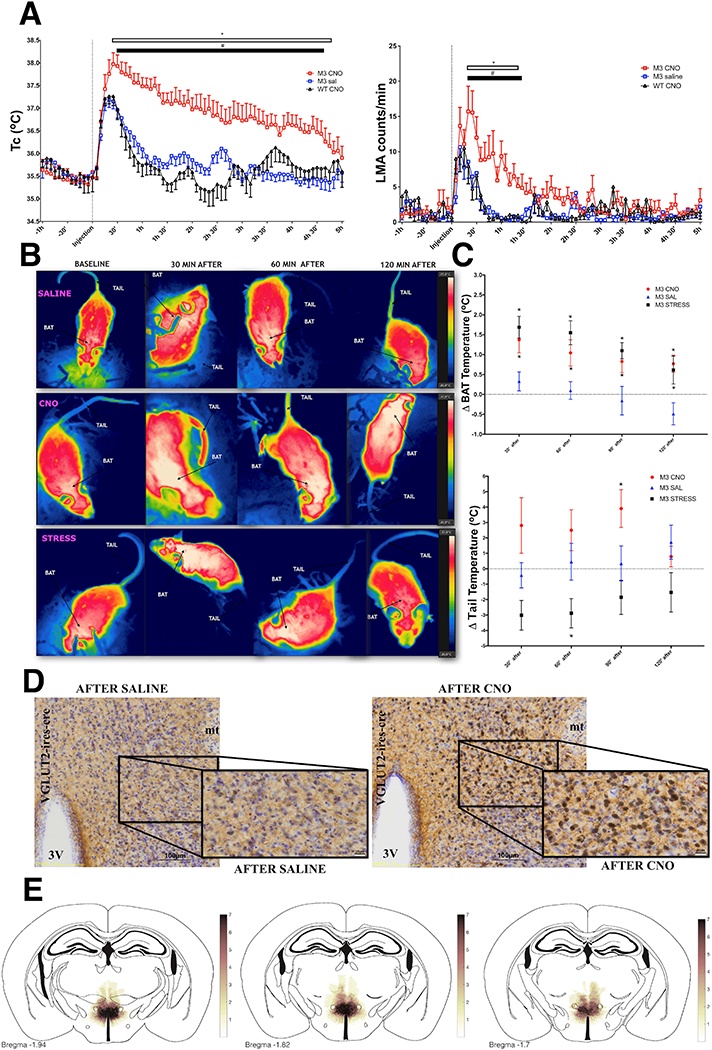
Figure 3. Activation of DHAVglut2+ neurons induces an increase in body temperature and locomotor activity.

(A) Activation of DHAVglut2 neurons expressing the hM3Dq receptor (M3) by clozapine N-oxide (CNO, red) vs. saline caused a 1.5– 2.0°C elevation of Tc and a large increase in LMA; saline (n=7), CNO (0.3mg/kg) (n=7) and wild type mice after CNO (0.3mg/kg) (WT CNO, n=6) FTc (144,1228)=2.931, FLMA (144,1240)=1.715, two-way ANOVA, followed by Bonferroni’s post hoc test *p<0.0001 for M3 CNO compared with M3 saline; # p<0.0001 for M3 CNO compared with WT CNO. See also Figure S2. (B) Thermographic images showing temperature changes over the intrascapular brown adipose fat pad (BAT) and tail in mice in which DHAVglut2 neurons express hM3Dq (see also Video S1). The images across show baseline temperatures, then 30, 60 and 120 min after either an injection of saline (upper row, in which there is a small intial increase in BAT temperature corresponding with the fever of handling in panel a); or an injection of CNO (middle row, in which there is a strong increase in both BAT and tail temperature). By contrast, during cage exchange stress (lowest row), there is both activation of BAT and tail vasoconstriction, causing a lower tail temperature. (C)This paradoxical increase in both BAT and tail temperature in the animals treated with CNO (i.p.0.3mg/kg, n=7) compared to saline is shown quantitatively (n=7) F(8,76)=3.26 two-way ANOVA, followed by Bonferroni’s post hoc test *p<0.05. Psychological stress (n=8) by contrast induces an increase in BAT temperature similar to CNO F(8,76)=3.39, along with tail cooling, similar to the response to cooling or LPS. (D)CNO induces massive activation of cFos (black nucleus) in DHAVglut2 neurons that express hM3D(Gq)-mCherry (brown cytoplasm right) compared to injection of animals with saline (left), see also Figure S3. (E) A heatmap showing overlap of AAV-DIO-hM3Dq-mCherry injection sites in the DHA.
