Figure 3.

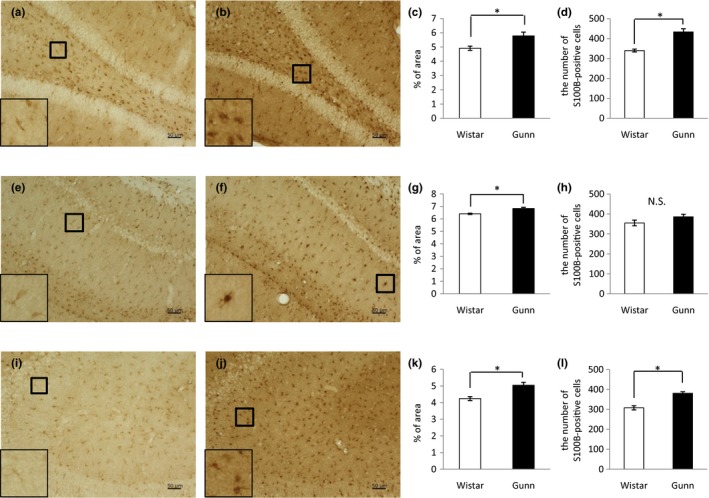
Immunoreactivity for S100B in the hippocampus. Representative images of DAB staining in the DG of Wistar (a) and Gunn rats (b), CA1 of Wistar (e) and Gunn rats (f), and CA3 of Wistar (i) and Gunn rats (j). The magnified pictures of S100B‐positive cells are shown in the lower‐left insets. The scale bars indicate 50 μm. Quantification data for S100B immunoreactivity in the DG (c), CA1 (g), and CA3 (k). The number of S100B‐positive cells in the DG (d), CA1 (h), and CA3 (l). Each value is the mean ± SEM (N = 6). *p < 0.05. N.S., not significant
