
Figure 10.
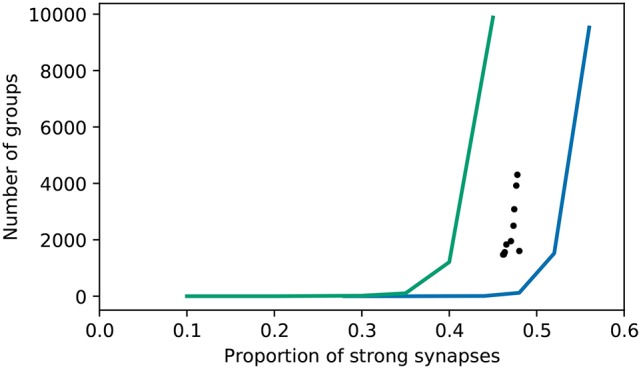
Number of groups identified by the original algorithm as a function of the proportion of excitatory synapses that are strong. Realizations of the bitwise identical reproduction; black dots. Surrogate data with connections randomly selected to be strong (excitatory-excitatory synapses only—all excitatory-inhibitory synapses are strong); blue curve. Surrogate data with connections randomly selected to be strong (all excitatory); green curve.