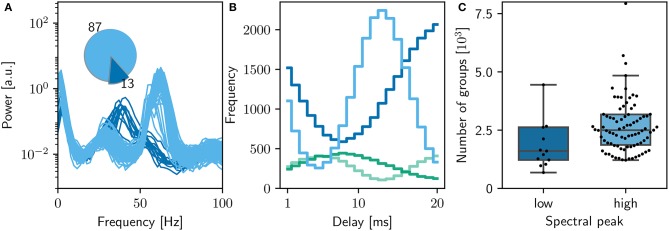
Figure 5.
Sensitivity of network dynamics of the bitwise identical NEST implementation to choice of random seed. (A) Power spectrum of the rate envelope over the final 10 s for the excitatory population for 100 different seeds. Light blue curves indicate runs resulting in a high gamma peak (60 Hz), dark blue curves those with a low gamma peak (40 Hz). Inset shows the proportion in which these two activity profiles occur. (B) The equilibrium distribution of weights (Maximum 10mV, blue curves; minimum 0mV, green curves) as functions of the delay in the high (light) and low (dark) gamma dynamical states. (C) Relationship between dynamical state and number of polychronous groups found. Boxes show median and interquartile range (IQR); whiskers show additional 1.5 × IQR or limits of distribution.

