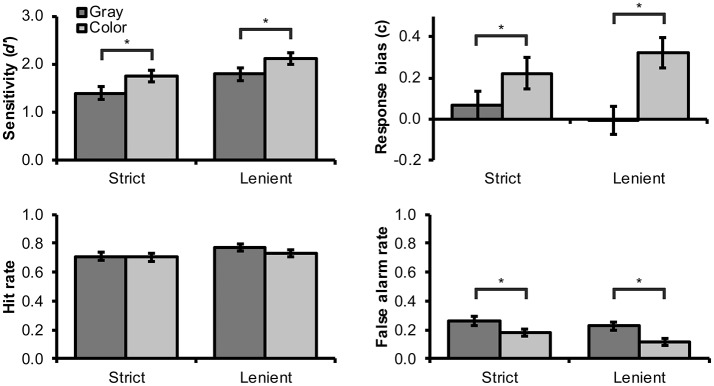
Figure 2.
Mean (and SEM) values for d' sensitivity index, c response bias index, hit rate, and false alarm rate for the identification task by color and spatial frequency matching conditions. Statistically significant differences between color and grayscale images are denoted with an asterisk (“*”).

