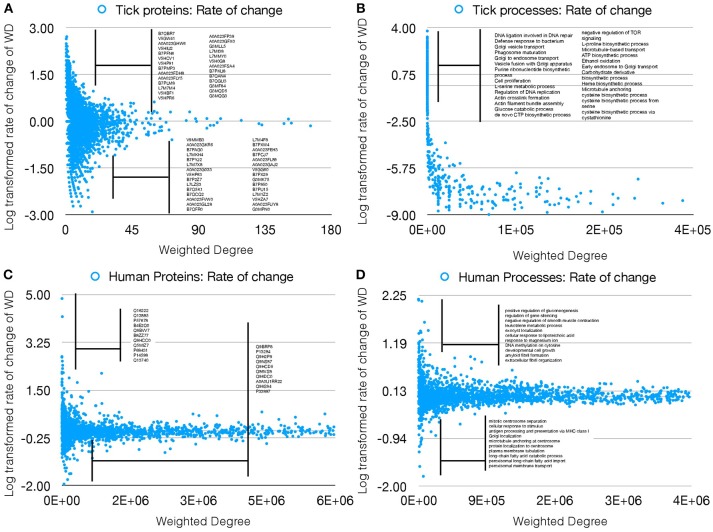
Figure 3.
Rate of WD change of tick and human cell protein and processes. (A) The rate of WD change of the proteins in tick vector cells. The WD of the proteins in UtC is shown, together with the log-transformed rate of change in ItC. Most highly over- and under-represented proteins are shown (3- and 5-fold for tick and human cells, respectively). Proteins represented only in UtC or ItC were not included. (B) The rate of change of WD of the cell processes in tick vector cells. The WD of the cell processes in ItC is shown, together with the log-transformed rate of change in ItC. Most highly over- or under-represented cell processes are shown. Processes appearing only in UtC or ItC were not included. (C) The rate of change of WD of the proteins in human cells. The WD of the proteins in UhC is shown, together with the log-transformed rate of change in IhC. Most highly over- and under-represented proteins are shown. (D) The rate of change of WD of the cell processes in human cells. The WD of the cell processes in IhC is shown, together with the log-transformed rate of change in IhC. Most highly over- and under-represented cell processes are shown.

