Fig. 3.

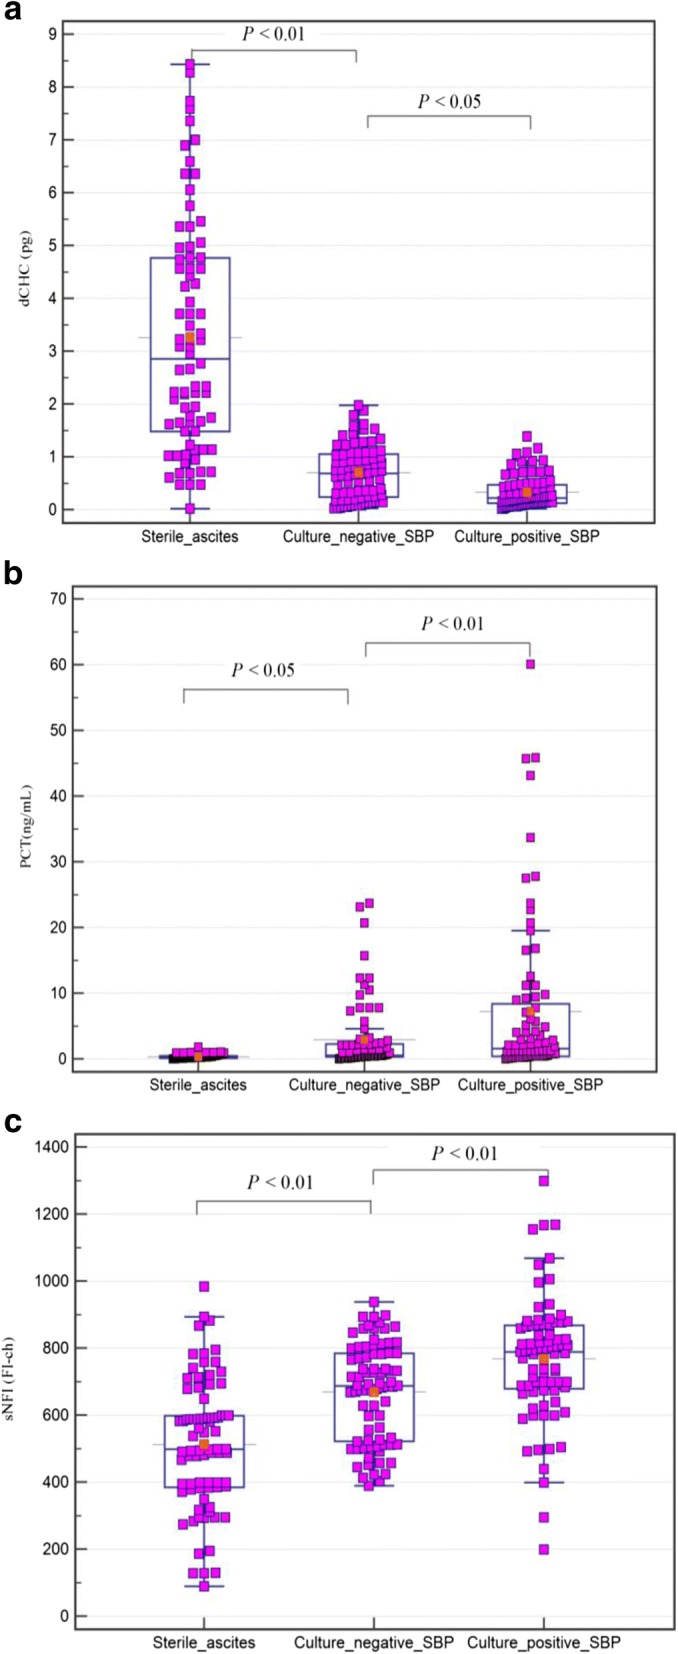
Comparison of dCHC(a), PCT(b) and sNFI(c) according to the ascitic fluid infection groups. In the box-and-whisker plot, the central box represents the interquartile range (IQR); the middle line represents the median

Comparison of dCHC(a), PCT(b) and sNFI(c) according to the ascitic fluid infection groups. In the box-and-whisker plot, the central box represents the interquartile range (IQR); the middle line represents the median