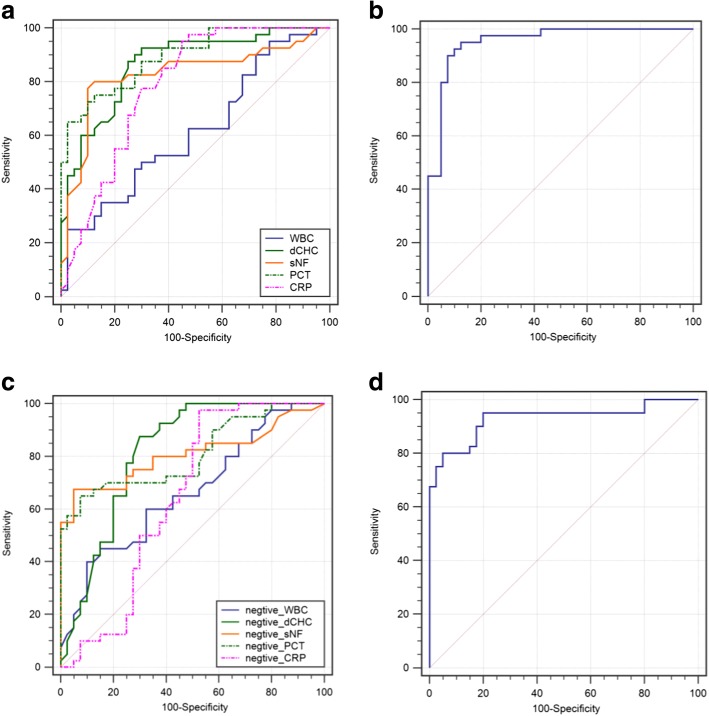
Fig. 4.
ROC curve of clinical markers for diagnosis of ascitic fluid infection. a ROC curve of clinical markers for diagnosis of culture-positive SBP. AUC for PCT was 0.865 (95% CI 0.814–0.932, P < 0.001), dCHC 0.849 (95% CI 0.799–0.918, P < 0.001), CRP 0.676 (95% CI 0.597–0.746, P = 0.0561), sNFI 0.857 (95% CI 0.802–0.920, P < 0.001), and WBC 0.627 (95% CI 0.563–0.701, P = 0.0783). For calculated score: AUC for a null hypothesis was 0.5. b ROC curve of calculated score for diagnosis of culture-positive SBP. AUC was 0.947 (95% CI 0.882–0.988, P < 0.001). AUC for a null hypothesis was 0.5. c ROC curve of clinical markers for diagnosis of culture-negative SBP. AUC for PCT was 0.809 (95% CI 0.726–0.888, P < 0.001), dCHC 0.816 (95% CI 0.753–0.874, P < 0.001), CRP 0.645 (95% CI 0.530–0.739, P = 0.0667), sNFI 0.807 (95% CI 0.737–0.887, P < 0.001), and WBC 0.615 (95% CI 0.550–0.686, P = 0.0774). For calculated score: AUC for a null hypothesis was 0.5. d ROC curve of calculated score for diagnosis of culture-negative SBP. AUC for calculated score was 0.929 (95% CI 0.869–0.974, P < 0.001). AUC for a null hypothesis was 0.5. ROC: receiver operating curve, AUC: area under the curve

