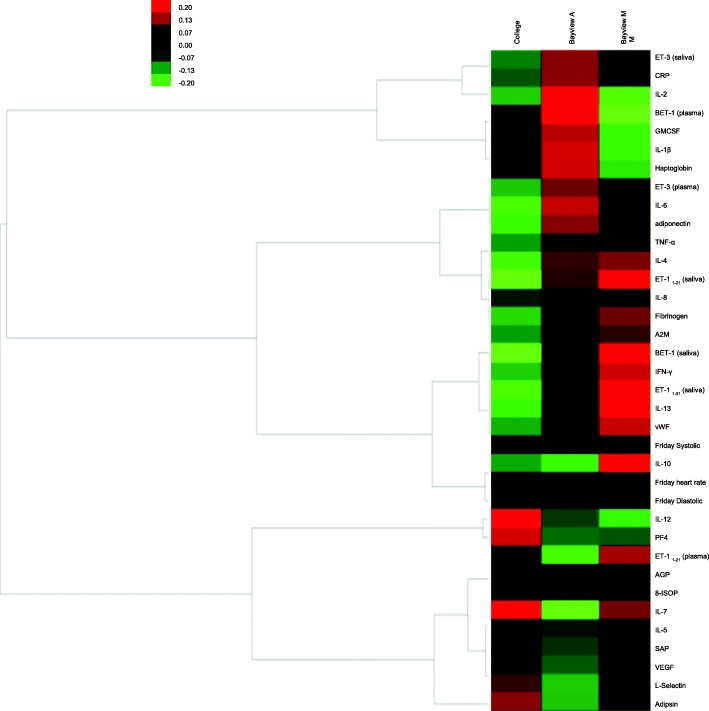
Fig. 1.
Heat map and hierarchical clustering analysis results. Bayview A – Bayview Ambient (“without” mask); Bayview M- “with” mask; Biomarker levels are expressed as fold changes with respect the subject’s average biomarker level through the entire exposure period (Red-upregulation; Green-down-regulation)

