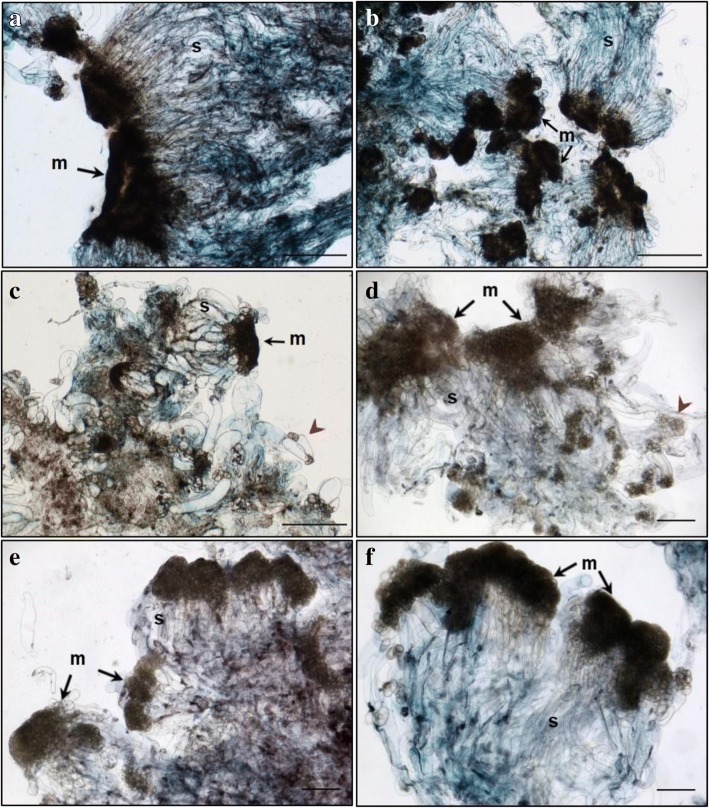
Fig. 2.
Structure of embryonal masses from primary, secondary and tertiary lines of genotype SD4. a / SD4; b / SD4–2; c / SD4–8; d / SD4–8-1; e / SD4–8-2 f / SD4–8-3. Arrowheads in c, d mark small singulated somatic embryos; m – meristem of polyembryogenic centers, s – suspensor; Trypan blue staining of squashes of fresh EMs. Scale bar = 500 μm

