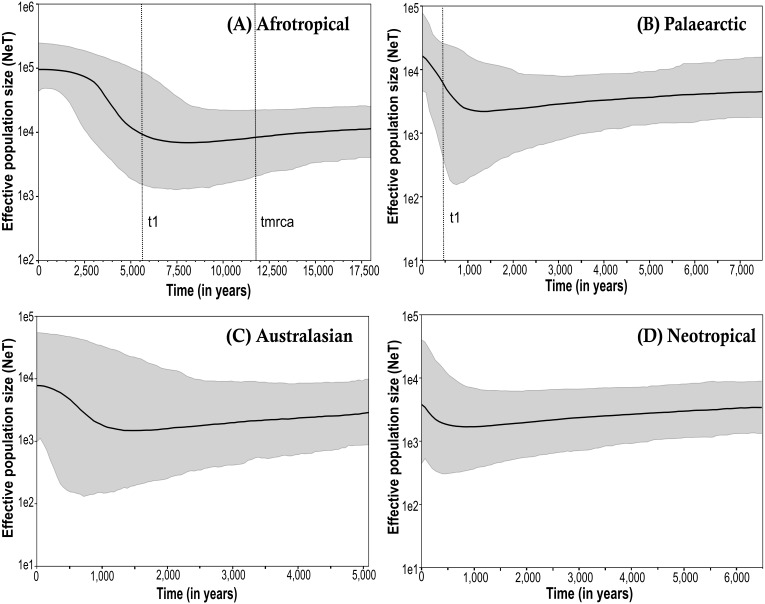
Figure 3. Bayesian skyline plot (BSP) estimate of Medfly demographic history for the biogeographic regions (A) Afrotropical; (B) Palaearctic; (C) Australasian and (D) Neotropical.
The X-axis is in units of time before present (BP), and the Y-axis is equal to the log scale of NeT (the product of effective population size and the generation time in years). Each BSP plot described the demographic history per biogeographic region represented by a median line (solid line horizontal) with 95% High Posterior Distribution in grey (HPD; equivalent to margins of error). The dashed line t1 is the time of population expansion per biogeographic group. The Time to the most recent common ancestor (tmrca) is represented in the Afrotropical population around 11,600 BP.

