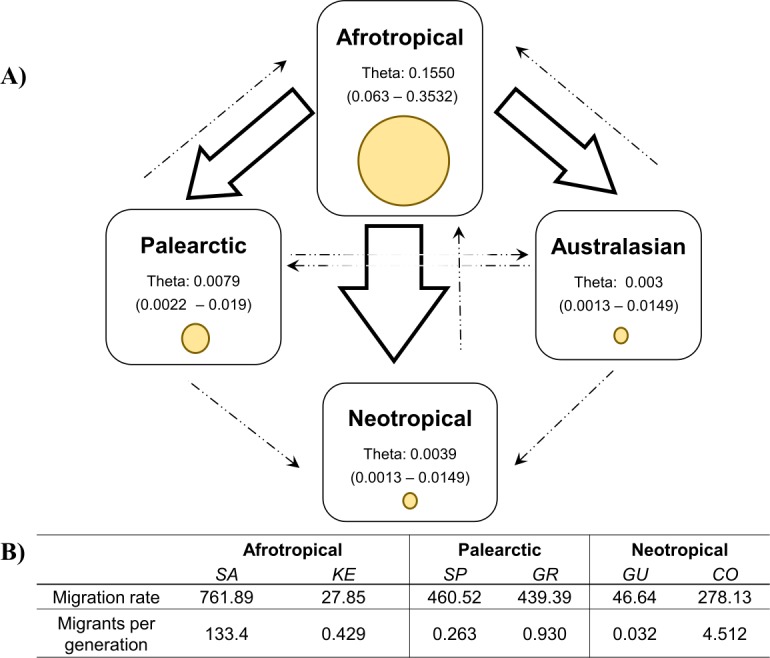
Figure 4. Values of theta and migration between the biogeographical regions.

The figure (A) contains the theta and migration values among the four biogeographic regions. Yellow circles represent the theta value per biogeographic group and the values in brackets are the 95% HPD confidence. The arrows indicate the direction of the migration and their thickness is the proportion of the migrants per generation. (B) Migration rate and migrants per generation of specific medfly populations within the biogeographic region, country names are abbreviated as in Table 2
