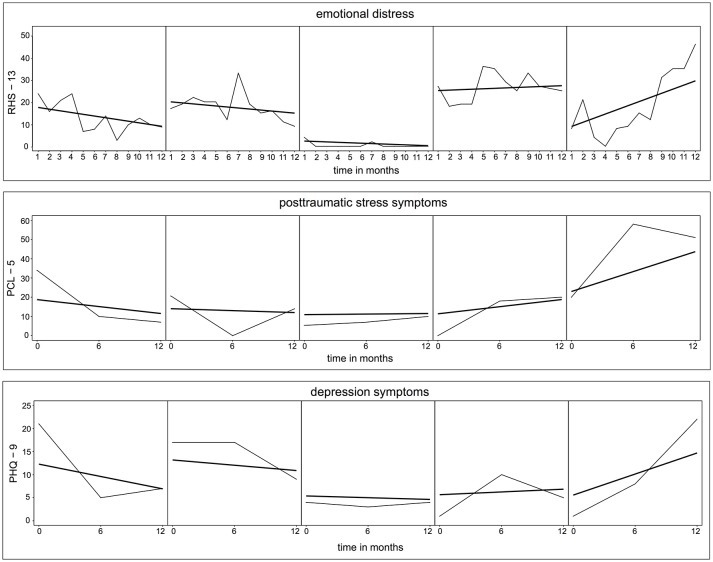
Figure 3.
Raw and fitted individual time courses of emotional distress, posttraumatic stress symptoms, and depression symptoms for exemplary participants. Thin lines represent the actual course of symptoms. Bold lines depict the individually predicted LGMs. Selection procedure: Participants were ordered by the gradient of their slope and based on the quartiles exemplary participants were chosen.

