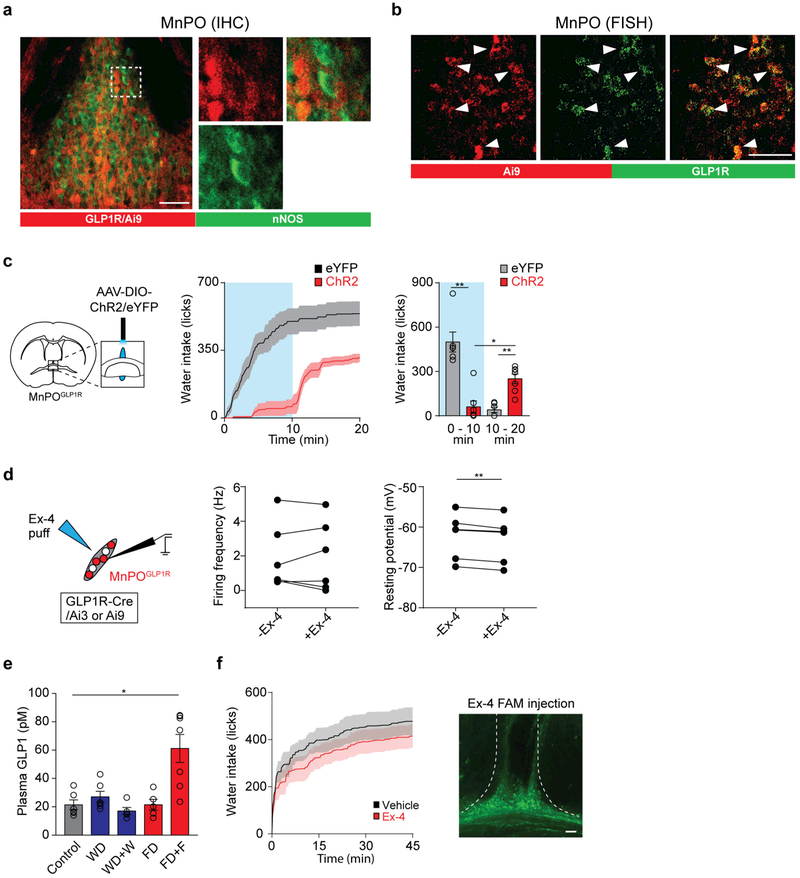
Extended Data Figure 6 |. The MnPOGLP1R population does not overlap with nNOS-expressing neurons.
a, nNOS antibody staining (green) of the MnPO from a Glp1r-cre/Ai9 transgenic mouse expressing tdTomato in MnPOGLP1R neurons (red). No substantial overlap was observed between these populations (4.3 ± 0.9% of GLP1R-expressing neurons, n = 3 mice). b, Fluorescence in situ hybridization (FISH) shows that a majority of Ai9 expression (red, 91.9 ± 2.4%, n = 3 mice) closely overlaps with endogenous GLP1R expression (green). c, Left, a diagram showing optogenetic stimulation of MnPOGLP1R neurons transduced with AAV-DIO-ChR2-eYFP or AAV-DIO-eYFP. Right, stimulation of ChR2-expressing MnPOGLP1R neurons inhibited drinking after water restriction as compared to eYFP controls (n = 7 mice for ChR2, n = 6 mice for controls, blue box indicates the Light-ON period). For statistical analysis, we used the same dataset as for 0–10 min from Fig. 2e. d, GLP1 has minor effects on acute drinking behaviour. A diagram of whole-cell recording from MnPOGLP1R neurons is shown on the left. A GLP1 agonist, exendin-4 (Ex-4), had no effect on the firing frequency of MnPOGLP1R neurons in brain slice preparation (middle, n = 6 neurons). However, there was a small decrease in the resting membrane potential (right, n = 6 neurons). e, Enzyme-linked immunosorbent assay analysis of plasma GLP1 levels. Feeding behaviour induced robust plasma GLP1 secretion whereas water intake did not (n = 5 mice for WD + W and FD, n = 6 mice for control and WD, and n = 7 mice for FD + F). f, Left, intra-cranial injection of Ex-4 (red trace, n = 7 mice) into the MnPO had no effect on water intake after water deprivation as compared to vehicle injection (artificial cerebrospinal fluid, black trace, n = 7 mice). Right, a representative injection pattern visualized with fluorescent Ex-4 FAM. *P < 0.05, **P < 0.01, two-tailed Mann–Whitney U test or paired t-test or Kruskal–Wallis one-way ANOVA test with Dunn’s correction for multiple comparisons. All error bars and shaded areas show mean ± s.e.m. Scale bars, 50 μm.

