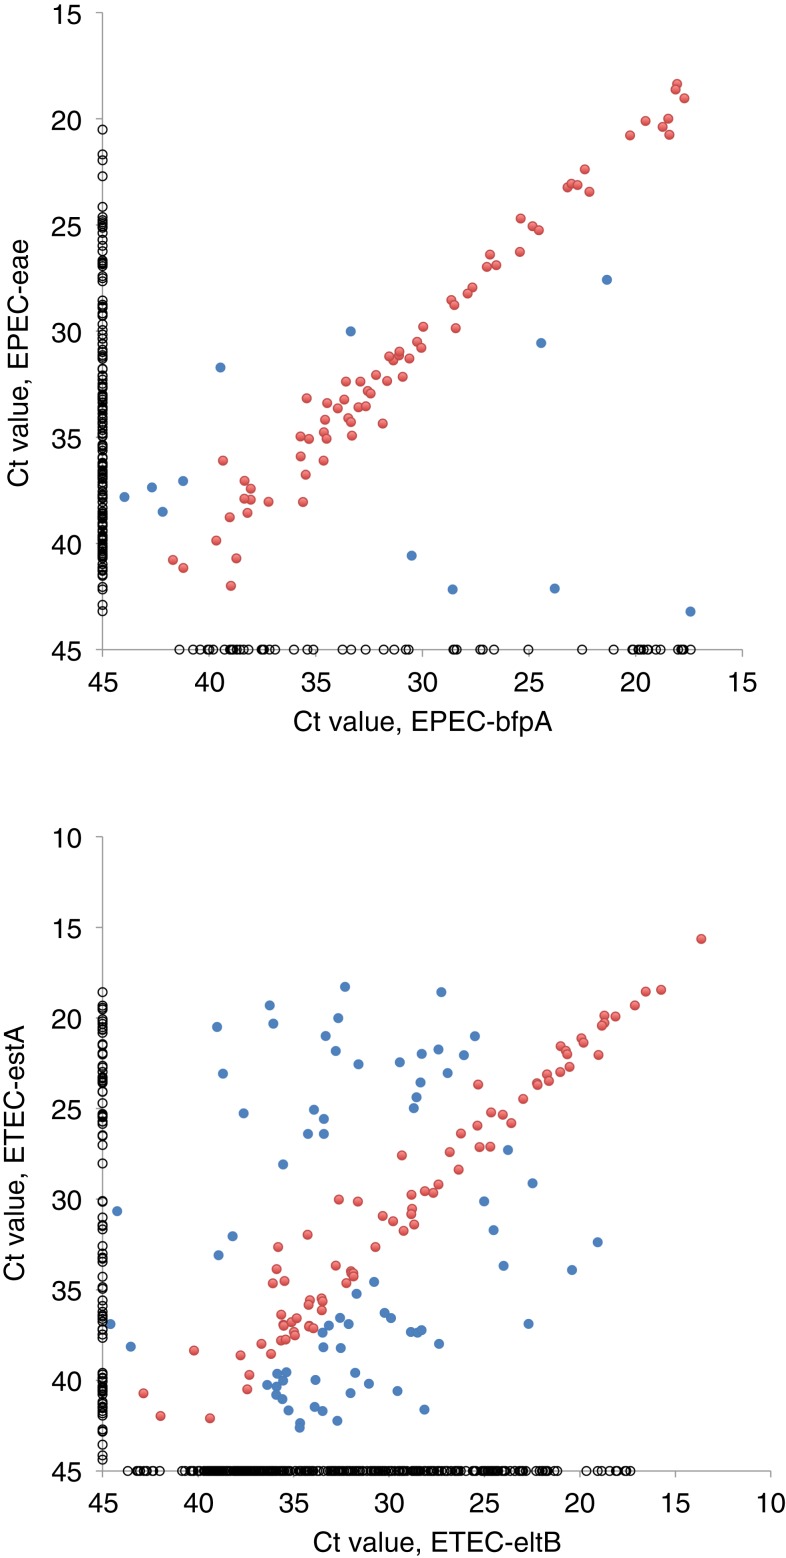
Figure 3.
Threshold cycle (Ct) values for 84 samples that were positive for enteropathogenic E. coli (EPEC)-eae and EPEC-bfpA (upper) and for 153 samples that were positive for enterotoxigenic E. coli (ETEC)-eltB and ETEC-estA (lower). Pearson’s correlation coefficient (ρ) was 0.79 for eae and bfpA, and 0.61 for eltB and estA (P < 0.0001 for both). Red dots represent samples with less than 3.3 cycles difference in Ct value, suggesting that the target genes were present in the same bacterial strain (72 with bfpA and eae; 82 with eltB and estA). Samples with ≥ 3.3 cycles difference are shown as blue dots (12 bfpA and eae; 71 eltB and estA). Fifty-four samples that were positive for EPEC-bfpA alone, 177 for EPEC-eae alone, 303 for ETEC-eltB alone, and 94 for ETEC-estA alone were given a Ct value of 45 and are shown as black circles.

