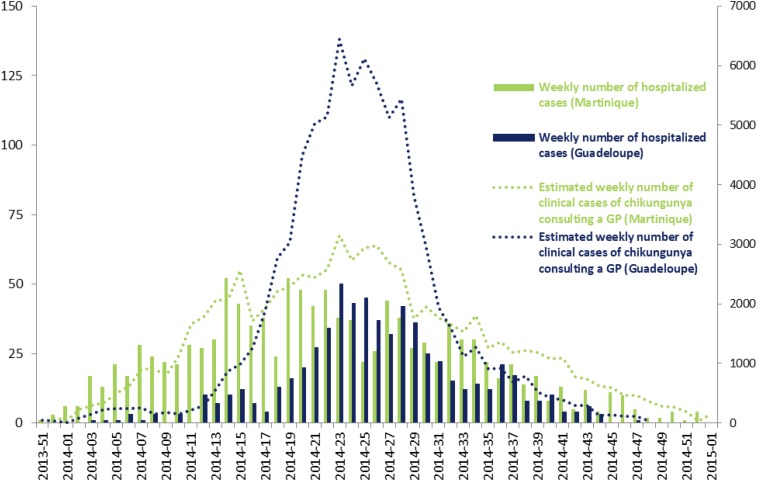
Figure 2.
Weekly number of hospitalized chikungunya virus (CHIKV) cases (left axis) and weekly estimated number of clinical CHIKV cases consulting general practitioners (right axis) in the population during the CHIKV epidemics in Martinique and Guadeloupe - December 2013 to January 2015. This figure appears in color at www.ajtmh.org.

