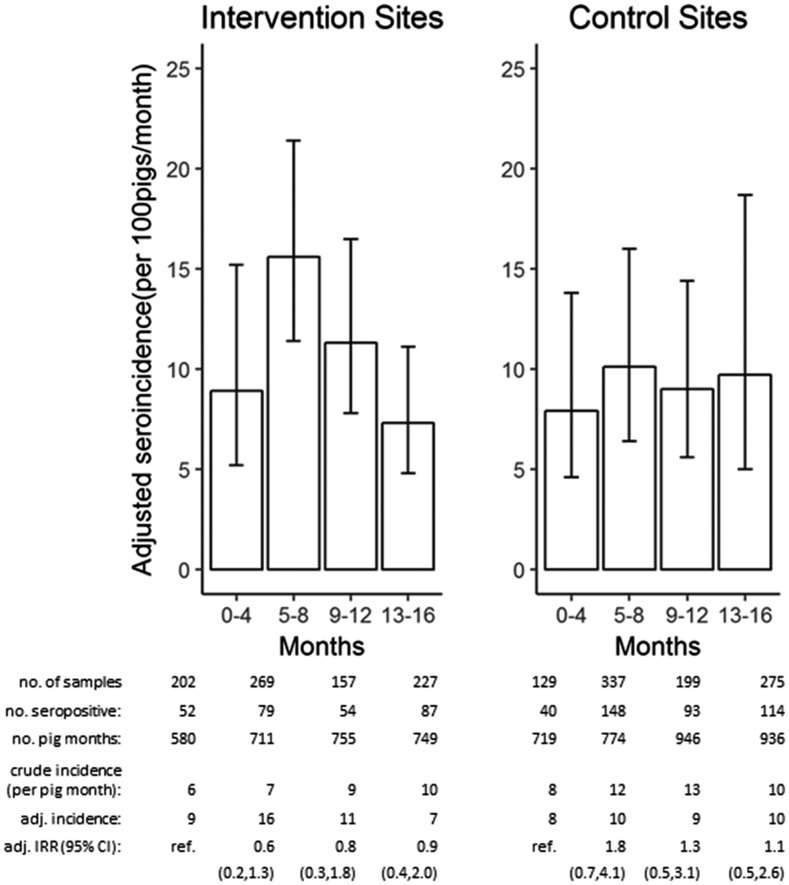
Figure 1.
Population-averaged seroincidence among 100 unexposed (at risk) pigs per month in intervention villages compared with control villages. Error bars represent 95% confidence interval (CI). Accompanying table shows number of total samples and seropositive samples per round, total number of pig-months contributed, crude and population-averaged incidence, and the incidence rate ratio (IRR) and 95% CI for each time point relative to baseline in both intervention and control groups.

