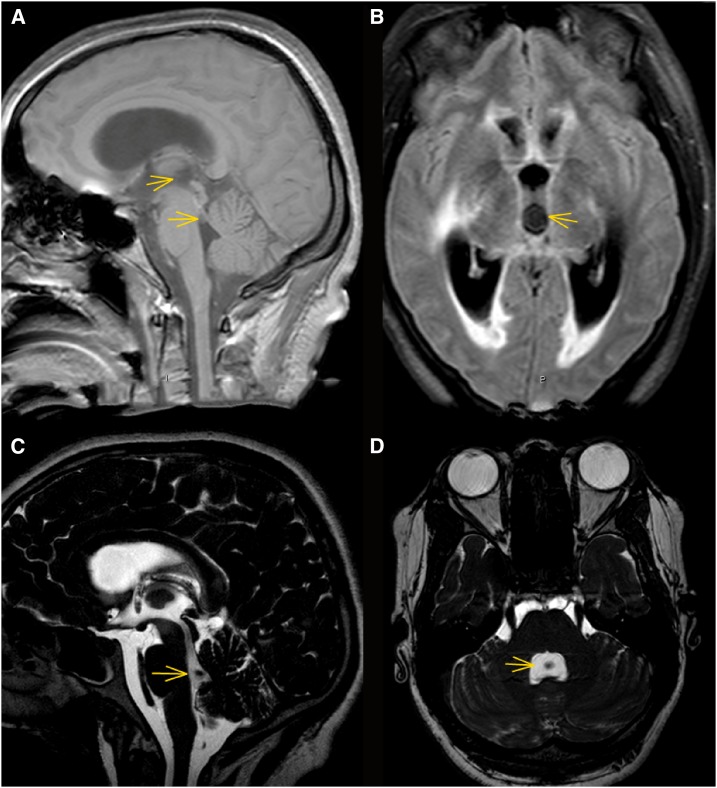
Figure 1.
MRI imaging of the case. Panels (A) and (B) are imaging performed on the day of presentation, February 7, 2011, panel (C) on the day after presentation, February 8, 2011 and panel (D) on the day of admission to National Institutes of Health on June 2, 2011. Panel (A) is a sagittal T1 weighted fast field Echo (FFE) image revealing a barely visible third ventricle cyst showing [better seen in the axial view in Panel (B)] and part of the cyst in the process exiting the aqueduct into the fourth ventricle. Arrows delineate the cyst in the third and fourth ventricles. Panel (B) is an axial fast-attenuated inversion recovery image showing acute hydrocephalus with transependymal flow and a third ventricular cyst (arrow). Panel (C) is a cerebrospinal fluid-driven equilibrium radiofrequency reset pulse image demonstrating the scolex now fully situated in the fourth ventricle. Panel (D) is an axial balanced FFE image on June 2, 2011 (balanced fast field echo) image showing a cyst occupying the fourth ventricle (arrow) with a calcified scolex seen as a void in the middle of the cyst. This figure appears in color at www.ajtmh.org.

