FIGURE 1.

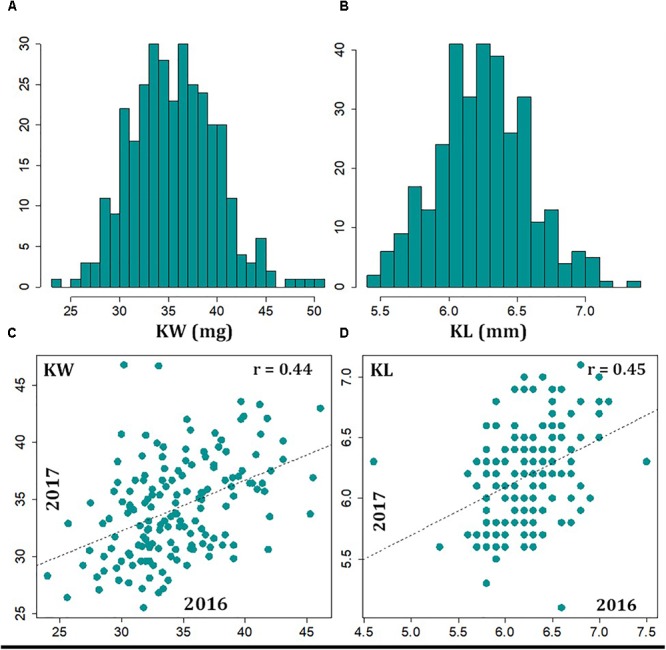
Distribution of 2-year BLUP values kernel weight (A) and kernel length (B), and correlations, as evidence of technical repeatability, observed between 2016 and 2017 data for kernel weight (C) and kernel length (D).

Distribution of 2-year BLUP values kernel weight (A) and kernel length (B), and correlations, as evidence of technical repeatability, observed between 2016 and 2017 data for kernel weight (C) and kernel length (D).