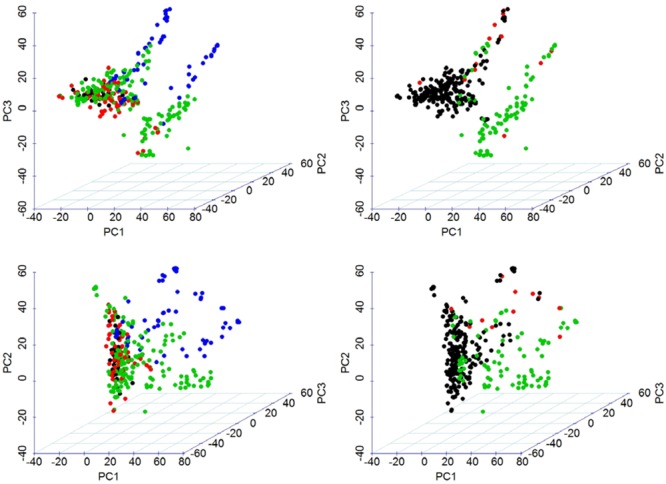
FIGURE 2.

Visualization of population stratification using three-dimensional scatter plot of the first three PCs estimated from 60,134 SNP markers. Top panel shows PC1, PC2, and PC3 in x-, y-, and z-axis configuration. Bottom panel shows PC1, PC3, and PC2 in x-, y-, and z-axis configuration. This allows a more-informed visualization. The left panel shows grouping by year-group and the right panel shows grouping by TaSus2-2B representing 2B.2G translocation from T. timopheevii.
