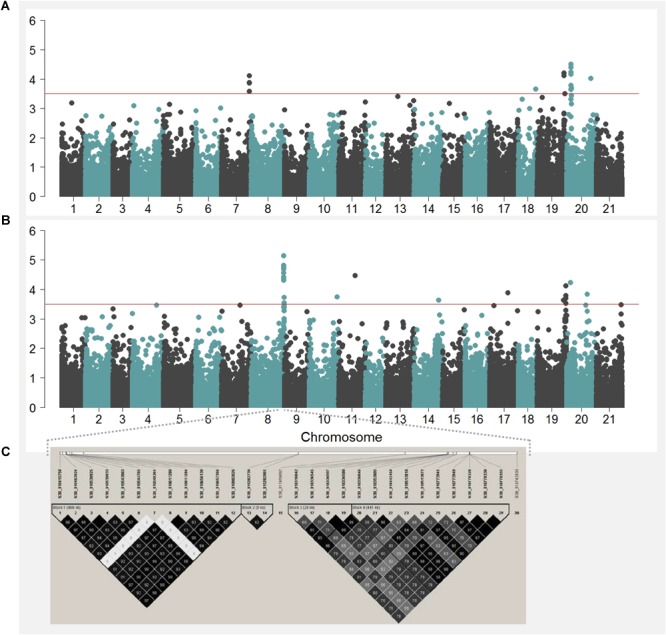
FIGURE 4.

Manhattan plots showing negative log p-values of SNPs tested across the 21 chromosomes (i.e., 1 = 1A, 2 = 1B, 3 = 1D, …, 20 = 7B, and 21 = 7D) obtained from GWAS by using 2-year BLUP values for kernel length (A) and kernel weight (B). The haplotype blocks estimated for the 30 SNP markers located on the region significantly associated with kernel weight on chromosome 3B is shown in (C).
