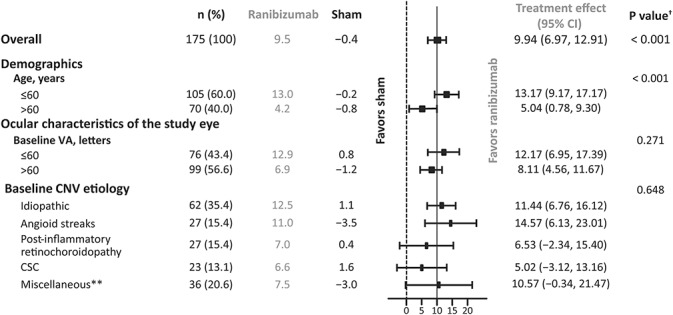
Fig. 4.

Change in BCVA from baseline to Month 2 in each of the specified subgroups (full analysis set* [observed]). *Consisted of all randomized patients to whom treatment regimen has been assigned. †P value is the interaction between the subgroup and treatment; P values > 0.05 are consistent with an equal treatment effect across the subgroup categories. **Etiologies that did not fit into the other CNV etiology subgroups and were insufficiently frequent to form a separate subgroup.
