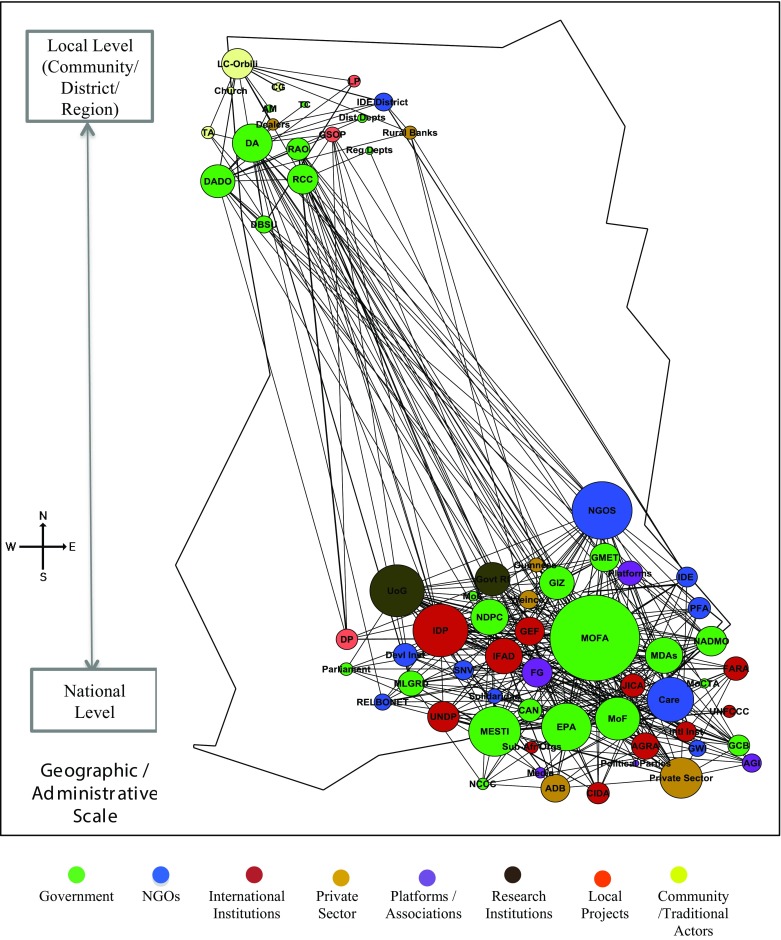
Fig. 3.

Baseline network map: Undirected network map of adaptation actors: Nodes on the map represent the 66 actors in the network from local to national actors. The edges between the actors are weighted to represent multiple relations and strength of interactions between actors. The node size of actors is proportional to the number of weighted edges connected to the node. Refer to Table S1 in the Supplementary Electronic Material for names of actors and more details
