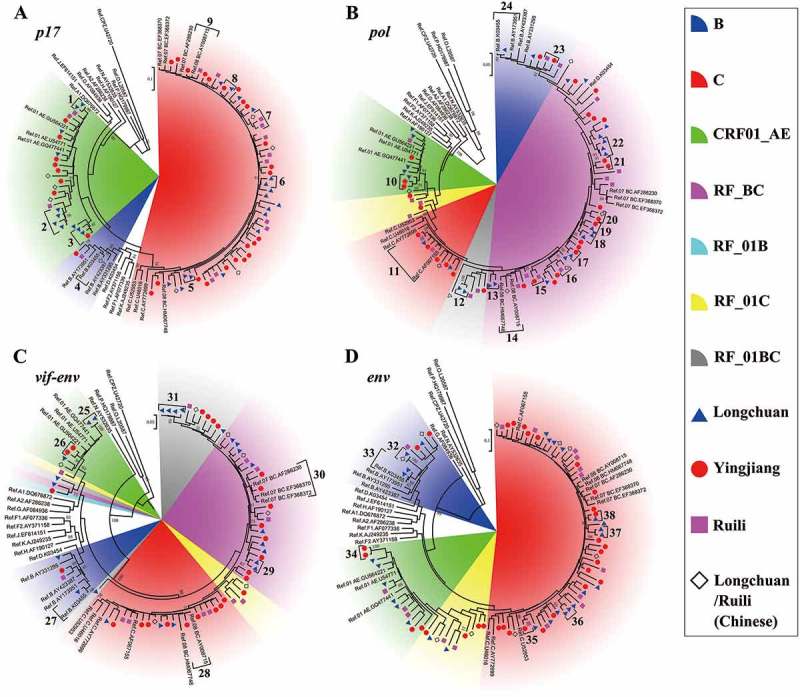
Figure 2.

Maximum likelihood trees and cluster analysis results for the HIV-1 p17, pol, vif-env and env fragments sampled from Burmese injecting drug users in Yunnan, China. The sectors with different colors indicate different subtypes/recombinant forms of HIV-1; the blue triangles, red spots and purple squares indicate the sequences that were sampled in Longchuan, Yingjiang and Ruili Counties of Dehong Prefecture among Burmese injecting drug users, respectively; the black rhombuses indicate the sequences that were sampled in Longchuan and Ruili Counties of Dehong Prefecture among Chinese injecting drug users; and the brackets with numbers indicate transmission clusters that were identified by Cluster Picker.
