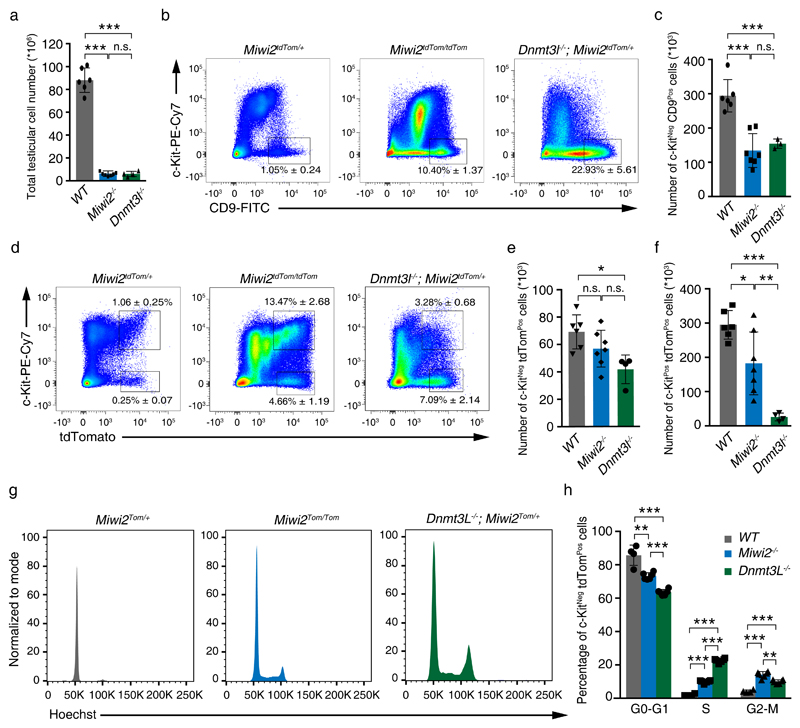
Figure 3. Defective reprogramming affects undifferentiated spermatogonia numbers, proliferation and differentiation.
(a) Total testicular cell numbers of Miwi2tdTom/+ (wild-type, WT), Miwi2tdTom/tdTom (Miwi2-/-) and Dnmt3l-/-; Miwi2tdTom/+ (Dnmt3l-/-) 8-week-old mice are shown. Error bars represent a standard deviation of the mean. Individual data points are shown. (b) Representative FACS plots of live CD45Neg CD51Neg gated testicular cells from 8-9-week-old mice of the indicated genotype is shown. Numbers indicate the percentage of live CD45Neg CD51Neg c-KitNeg CD9Pos cells. (c) Enumeration of live CD45Neg CD51Neg c-KitNeg CD9Pos cells per testis from 8-9-week-old mice of the indicated genotypes (as defined in panel a) is shown. Error bars represent a standard deviation of the mean. Individual data points are shown. (d) Representative FACS plots of live CD45Neg CD51Neg gated testicular cells from 8-9-week-old mice of the indicated genotype are shown. Numbers indicate the percentage of live CD45Neg CD51Neg c-KitNeg Miwi2-tdTomPos and live CD45Neg CD51Neg c-KitPos Miwi2-tdTomPos cells. (e-f) Enumeration of live CD45Neg CD51Neg c-KitNeg Miwi2-tdTomPos cells (e) and CD45Neg CD51Neg c-KitPos Miwi2-tdTomPos cells (f) per testis from 8-9-week-old mice of the indicated genotype (as defined in panel a) are shown. Error bars represent a standard deviation of the mean. Individual data points are shown. Number of animals (n) in a, c, e, f is 6 animals in WT, 7 animals in Miwi2-/-, 4 animals in Dnmt3l-/-, except panel c where 3 animals in Dnmt3l-/- is presented. (g) Representative cell cycle parameters as determined by DNA content in FACS analysis of live CD45Neg CD51Neg c-KitNeg Miwi2-tdTomPos gated testicular cells from 8-9-week-old mice of the indicated genotype are shown. (h) Enumeration of live CD45Neg CD51Neg c-KitNeg Miwi2-tdTomPos cells from 8-9-week-old mice of the indicated genotype (as defined in panel a) in G0-G1, S and G2-M cell cycle phases is shown. Error bars represent a standard deviation of the mean (n=4 animas in WT, 6 animals in Miwi2-/- and Dnmt3l-/-). Individual data points are shown. Significance in a, c, e, f, h was assessed using two-sided t-test. n.s. – not significant, * indicates a p value of < 0,01, ** indicates a p value of < 0,001, *** indicates a p value of < 0,0001. Source data for a, c, e, f, h is provided.

