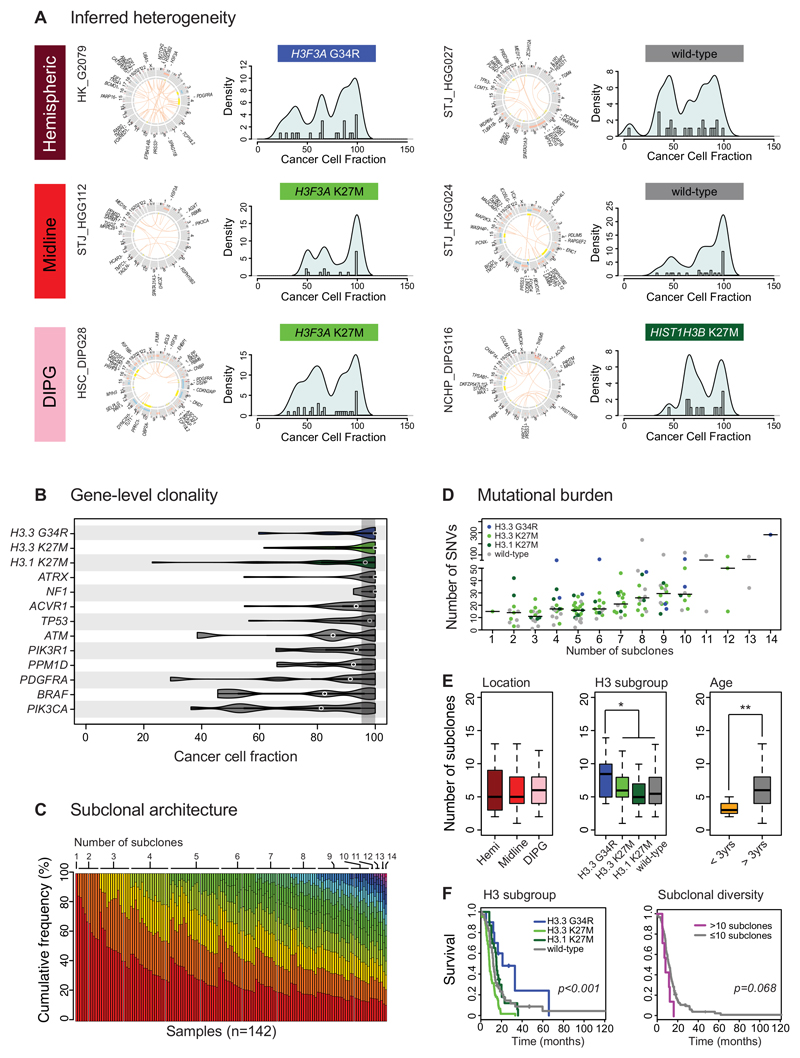
Figure 1. Paediatric GBM and DIPG harbour a complex subclonal architecture.
(A) Inferred heterogeneity. Representative images (from n=142) of six cases of pGBM and DIPG from different anatomical locations and with different histone H3 mutation status. For each case, a CIRCOS plot is given highlighting somatic SNVs and InDels (outer ring), DNA copy number changes (red=gain, blue=loss) and loss of heterozygosity (yellow) on the inner rings, and intra-/inter-chromosomal translocations inside the circle (orange). The CCF for each somatic coding mutation is plotted as a histogram with a kernel density overplotted. In all cases, in addition to a peak of mutations present in 100% cells (clonal) there is a complex pattern of subclonal mutations (<95% CCF) forming multiple peaks at low frequencies within a given tumour. (B) Gene-level clonality. Violin plot of CCFs for a given series of gene mutations across all 142 independent cases of pGBM and DIPG (H3.3 G34R/V, n=10; H3.3 K27M, n=61; H3.1 K27M, n=23; ATRX, n=22; NF1, n=4; ACVR1, n=27; TP53, n=; ATM, n=5; PIK3R1, n=8; PPM1D, n=11; PDGFRA, n=7; BRAF, n=5; PIK3CA, n=15). The shaded area represents a CCF of 95-100% to indicate a clonal mutation. Purported drivers such as histone H3 mutations, ATRX and NF1 are almost wholly found to be clonal (though there are single outliers in some instances). Other genes such as PIK3CA, BRAF and PDGFRA are frequently found to be mutated in smaller subclonal compartments of the tumours. Kernel densities of CCFs are plotted for all samples harbouring a given mutation (number of independent cases listed on figure). (C) Subclonal architecture. The number of subclones present in 142 pGBM and DIPG is calculated from somatic mutation data using the EXPANDS package27, and ordered first by the number of subclones (coloured using a rainbow palette) and then by the proportion of the tumour defined by the major clone in each tumour. A single case was found to be clonal, with more than 85% cases harbouring between 3-10 subclones. (D) Mutational burden. Dotplot of the number of somatic coding SNVs (y axis) against the number of subclones (x axis), demonstrating a significant positive relationship (Pearson r2=0.2188, p=4.36x10⁻⁹, n=142 independent samples). The horizontal bar represents the median value. Individual tumours are coloured by their histone H3 mutation status, with outliers often seen to harbour H3.3 G34R (blue). (E) Clinical and molecular correlates of subclonal numbers. Boxplots highlighting no differences in the number of subclones on the basis of anatomical location, but an increased number in H3.3 G34R tumours (p=0.044, t-test), and a reduced number in infant cases (<3 years, p=0.0108, t-test) across all n=142 independent samples. The thick line within the box is the median, the lower and upper limits of the boxes represent the first and third quartiles, the whiskers 1.5x the interquartile range, and individual points outliers. (F) Prognostic implications. Kaplan-Meier curves demonstrating H3.3 G34R tumours have a longer overall survival than other pGBM and DIPG (p=3.94x10⁻⁶, log-rank test), however despite the association of this subgroup with an increased number of tumour subclones, an elevated subclonal diversity shows a clear trend towards shorter survival across all pGBM and DIPG (p=0.068, log-rank test). Comparisons we made including all n=142 independent samples. * p<0.05. **p<0.01.

