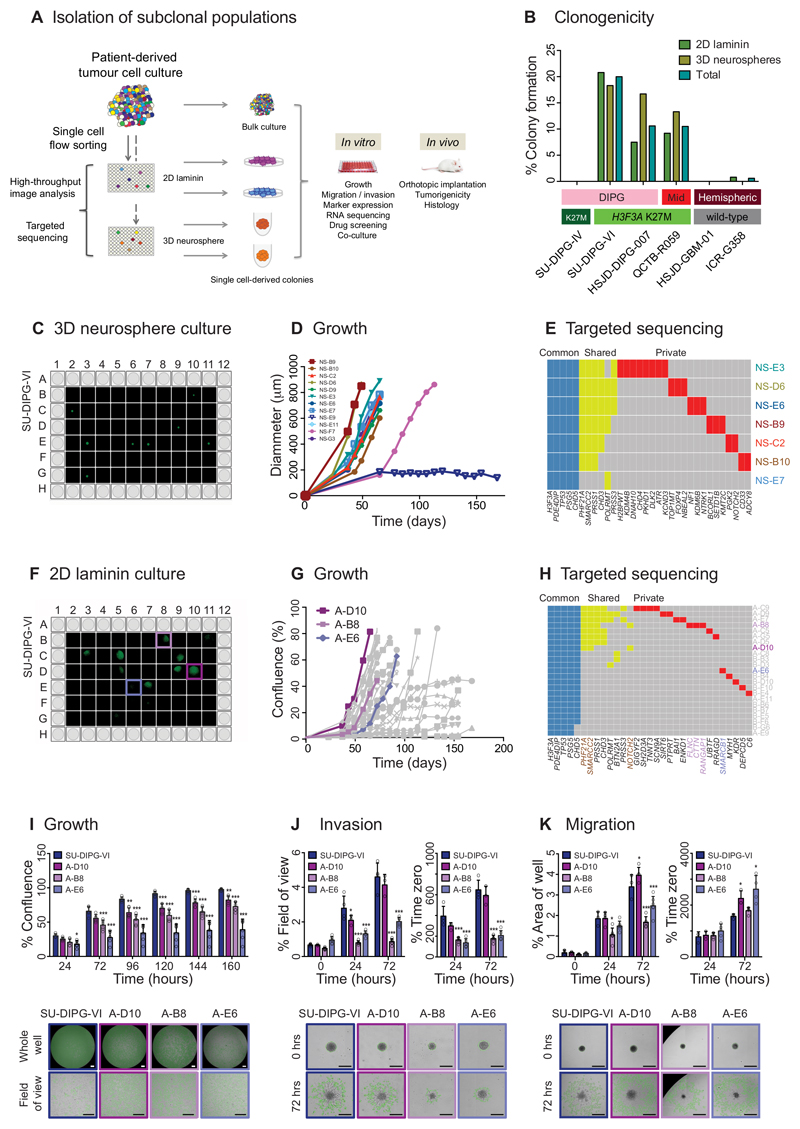
Figure 3. Isolation of genotypically and phenotypically diverse single stem-like cell-derived subclones of paediatric GBM and DIPG.
(A) Isolation of subclonal populations. Experimental schema for disaggregation of heterogeneous mixtures of patient-derived tumour cells, flow sorting into single cells in 96-well plates, and allowing colonies to form as either 2D cultures adherent on laminin, or 3D neurospheres, all under stem cell conditions. Individual subclonal colonies are subjected to high-throughput phenotypic analysis and targeted resequencing, and further cultured for detailed in vitro and in vivo mechanistic comparison with heterogeneous bulk populations. (B) Clonogenicity. Percentage of single cells which formed colonies under 2D laminin and 3D neurosphere stem cell conditions are given for six pGBM and DIPG primary patient-derived cell cultures, labelled by anatomical location and histone H3 mutation subgroup. (C) 3D neurosphere culture from single cell-derived colonies from SU-DIPG-VI assessed by Celigo S imaging cytometer. (D) Growth of single cell-derived colonies over time, assessed as diammeter of neurosphere, labelled and colour-coded. (E) Targeted sequencing contingency plot of somatic mutations identified as common to all subclones (blue), shared amongst certain subclones (yellow) and private to individuals (red). (F) 2D laminin culture from single cell-derived colonies from SU-DIPG-VI assessed by Celigo S imaging cytometer. (G) Growth of single cell-derived colonies over time, assessed as diammeter of neurosphere, with subclones taken for later analysis highlighted: A-D10 (fast, purple), A-B8 (intermediate, pink) and A-E6 (slow, violet). (H) Targeted sequencing contingency plot of somatic mutations identified as common to all subclones (blue), shared amongst certain subclones (yellow) and private to individuals (red). Gene names are coloured to highlight private mutations in selected subclones, or common to A-D10 and A-B8 (brown). (I) Growth. Time-course for growth of selected subclones re-plated and grown over 160 hours, highlighting statistically significant differences among subclones and heterogeneous bulk cell populations of SU-DIPG-VI (blue). Representative images at 72 hours are provided from the Celigo S cytometer, with tumour cells marked in green. Data derived and representative images taken from n=3 independent experiments. Scale bar = 500μm. (J) Invasion. Time-course of invasion of cells into a matrigel matrix over 72 hours, either as percentage of the total area in the field of view covered by invading cells, or as a percentage of time zero. Representative images given at 72 hours, with extent of tumour cell invasion marked in green. Data derived and representative images taken from n=3 independent experiments. Scale bar = 500μm. (K) Migration. Time-course of tumour cell migration onto matrigel over 72 hours, either as percentage of the total area of the well covered by migrating cells, or as a percentage of time zero. Representative images given at 72 hours, with extent of tumour cell migration marked in green. Data derived and representative images taken from n=3 independent experiments. Scale bar = 500μm. * p<0.05. **p<0.01. ***p<0.001. All graphs represent mean +/- standard deviation.

