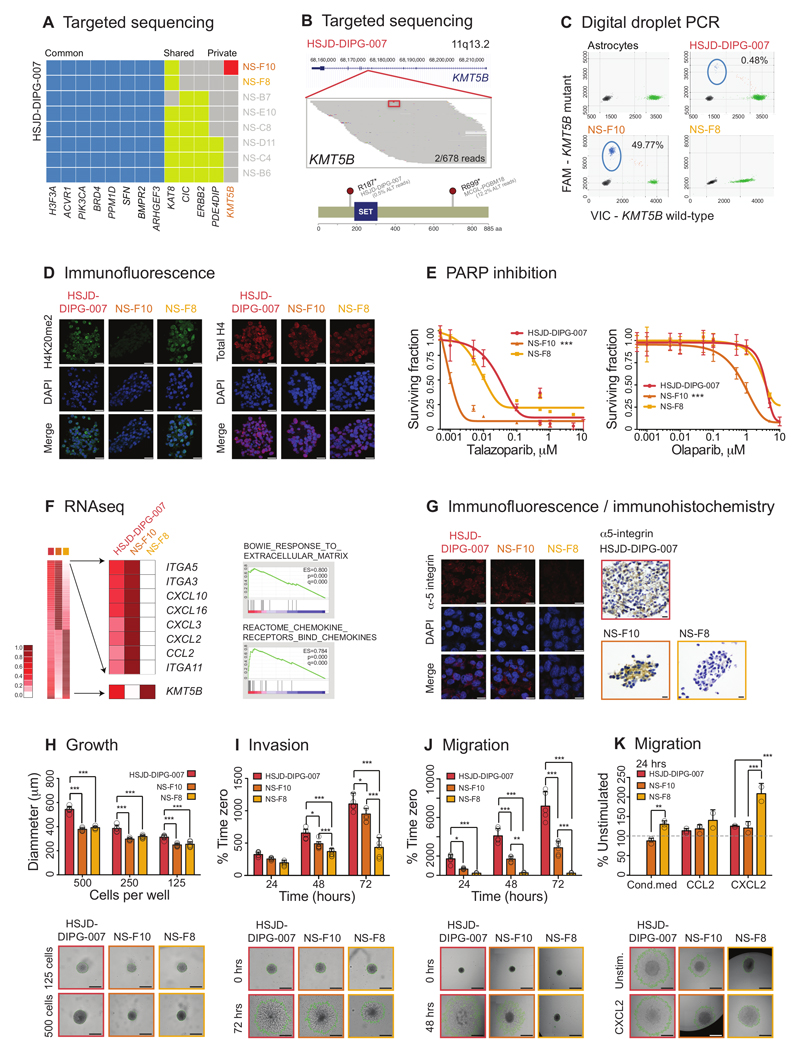
Figure 4. Rare DIPG subclones with pathogenic somatic variants driving the cellular phenotype.
(A) Targeted sequencing. Contingency plot of common (blue), shared (yellow) and private (red) somatic mutations in single cell-derived neurospheres from primary patient-derived cell culture HSJD-DIPG-007. NS-F10 is the only subclone to harbour a mutation in KMT5B. (B) Pile-up representation of sequencing reads aligning to the KMT5B locus at 11q13.2. The R187* (c.559G>A) variant is highlighted in red (boxed for clarity) and is present in 2/678 reads of original heterogeneous sample. Cartoon representation of mutations identified in HSJD-DIPG-007 (c.559G>A, R187*, present in 0.47% total reactions by ddPCR) and MCGL-PGBM184 (c.2095G>A, R699*, present in 12.2% total reads by exome sequencing). Amino acid position labelled, and SET domain coloured blue. (C) Digital droplet PCR. Plot of assay for KMT5B wild-type (x axes) and R187* mutation (y axes) for normal human astrocytes, heterogeneous bulk cells, and subclones NS-F10 and NS-F8. Mutant reads are present in 49.77% droplets from NS-F10, equating to 99.64% cells harbouring a heterozygous mutation. They are absent from astrocytes and NS-F8, though are found in 0.48% droplets from the original bulk preparation. Taken from n=3 independent experiments. (D) Immunofluorescence. Heterogeneous bulk HSJD-DIPG-007 cells and subclones were stained using an antibody directed against H4K20me2 (green), or total H4 (red), with nuclei stained with DAPI (blue). Reduced expression of H4K20me2 is observed in KMT5B mutant NS-F10 cells. Representative images taken from n=3 independent experiments. Scale bar = 50μm. (E) PARP inhibition. Effect on cell viability (surviving fraction on y axes) of treatment of heterogeneous bulk cells and subclones with increasing concentrations of two different PARP inhibitors (x axes, log10 scale). ANOVA was used to test for significance of NS-F10 versus NS-F8 and HSJD-DIPG-007 bulk culture for talazoparib and olaparib. *** all p values <0.001. Data derived from n=3 independent experiments. (F) RNAseq. Heatmap of gene expression analysis from RNA sequencing data highlighting differential expression in KMT5B mutant NS-F10 subclones compared to wild-type NS-F8. The most highly elevated genes included a range of extracellular matrix remodellers (represented in gene set enrichment analysis by the gene set “BOWIE RESPONSE TO EXTRACELLULAR MATRIX”) and numerous secreted chemokines (gene set “REACTOME CHEMOKINE RECEPTORS BIND CHEMOKINES”). KMT5B itself is also differentially expressed. All cell preparations were sequenced n=1, and statistical comparisons made by Gene Set Enrichment Analysis using the Kolmogorov-Smirnov test (p) with multiple correction testing using the False Discovery Rate (q). (G) Immunofluorescence of bulk HSJD-DIPG-007 cells and subclones stained using an antibody directed against alpha-5 integrin (red). Nuclei are stained with DAPI (blue). Immunohistochemistry of embedded bulk HSJD-DIPG-007 cells and subclones stained using an antibody directed against alpha-5 integrin, and counterstained with haematoxylin. Representative images taken from n=3 independent experiments. Scale bar = 50μm. (H) Growth. Neurosphere growth of HSJD-DIPG-007 and derived subclones seeded with different cell densities showing significantly elevated growth in the heterogeneous bulk cells, but not among subclones. Data derived and representative images taken from n=3 independent experiments. Scale bar = 500μm. (I) Invasion. Time-course of tumour cell invasion into matrigel over 72 hours, as a percentage of time zero using the Celigo S cytometer. Representative images given at 72 hours, with extent of tumour cell invasion marked in green. Data derived and representative images taken from n=3 independent experiments. Scale bar = 500μm. (J) Migration. Time-course of tumour cell migration onto a fibronectin matrix over 72 hours, as a percentage of time zero using the Celigo S cytometer. Representative images given at 72 hours, with extent of tumour cell migration marked in green. Data derived and representative images taken from n=3 independent experiments. Scale bar = 500μm. (K) Migration in response to stimulation with either conditioned media from HSJD-DIPG-007 heterogeneous bulk cells, or the chemokines CCL2 and CXCL2. Values are given as a percentage of unstimulated cells at 24 hours using the Celigo S cytometer. Representative images are given, with extent of tumour cell migration marked in green. Data derived and representative images taken from n=3 independent experiments. Scale bar = 500μm. All comparisons carried out by ANOVA, * p<0.05. **p<0.01. ***p<0.001. All graphs represent mean +/- standard deviation.

