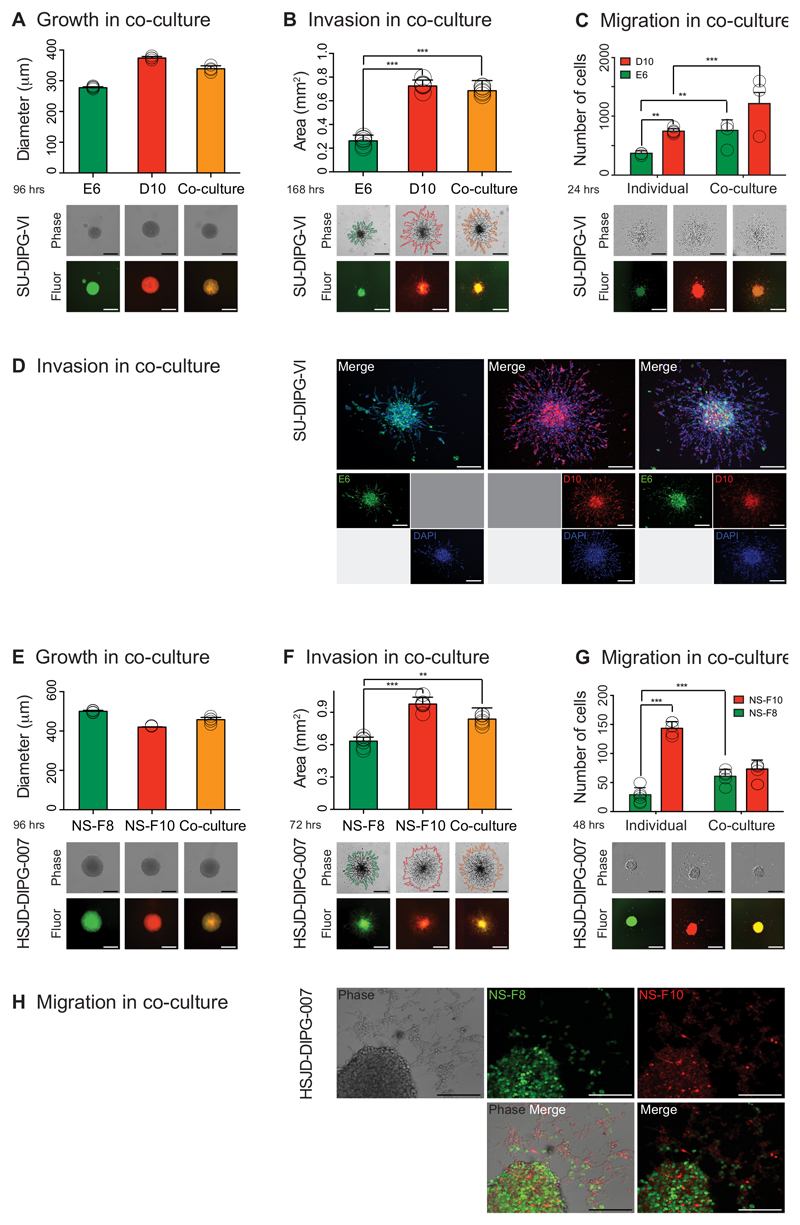
Figure 6. DIPG subclones co-operate to enhance tumorigenic phenotypes.
Individual subclones of SU-DIPG-VI (A-D) and HSJD-DIPG-007 (E-H) were differentially labelled and cultured either as pure populations or mixed in equal ratios. (A) Growth of co-cultured (yellow) and mono-cultured E6 (green) and D10 (red) cells plated as single neurospheres after 96 hours, measured as diammeter of the sphere, with representative images provided from the Celigo S cytometer under phase contrast and fluorescence. Data derived and representative images taken from n=3 independent experiments. Scale bar = 500μm. (B) Invasion of co-cultured (yellow) and mono-cultured E6 (green) and D10 (red) into matrigel over 72 hours, with area assessed by ImageJ software from representative images provided from the Celigo S cytometer under phase contrast and fluorescence. Co-cultures and D10 have significantly enhanced invasive capabilities compared to E6. Data derived and representative images taken from n=3 independent experiments. Scale bar = 500μm. (C) Migration of mono- and co-cultured E6 (green) and D10 (red) on matrigel, assessed by the number of differentially labelled distant cells at 24 hours, with representative images provided from the IncuCyte Zoom live-cell analysis system under phase contrast and fluorescence. Cells from individual subclones have enhanced migratory properties when cultured together compared to alone. Data derived and representative images taken from n=3 independent experiments. Scale bar = 500μm. (D) Confocal microscopy analysis of invasion of mono- and co-cultured E6 (green) and D10 (red) into matrigel after 4 days, with nuclei stained with DAPI. Poorly motile E6 cells are found to invade further and in greater numbers alongside D10 cells than when cultured alone. Representative images taken from n=3 independent experiments. Scale bar = 200μm. (E) Growth of co-cultured (yellow) and mono-cultured NS-F8 (green) and NS-F10 (red) cells plated as single neurospheres after 96 hours, measured as diammeter of the sphere, with representative images provided from the Celigo S cytometer under phase contrast and fluorescence. Data derived and representative images taken from n=3 independent experiments. Scale bar = 500μm. (F) Invasion of co-cultured (yellow) and mono-cultured NS-F8 (green) and NS-F10 (red) into matrigel over 72 hours, with area assessed by ImageJ software from representative images provided from the Celigo S cytometer under phase contrast and fluorescence. Co-cultures and NS-F10 have significantly enhanced invasive capabilities compared to NS-F8. Data derived and representative images taken from n=3 independent experiments. Scale bar = 500μm. (G) Migration of mono- and co-cultured NS-F8 (green) and NS-F10 (red) on fibronectin, assessed by the number of differentially labelled distant cells at 48 hours, with representative images provided from the IncuCyte Zoom live-cell analysis system under phase contrast and fluorescence. Cells from NS-F8 have enhanced migratory properties when cultured with NS-F10 compared to alone. Data derived and representative images taken from n=3 independent experiments. Scale bar = 500μm. (H) Confocal microscopy analysis of migration of mono- and co-cultured NS-F8 (green) and NS-F10 (red) on fibronectin after 3 days, with nuclei stained with DAPI. Poorly motile NS-F8 cells are found to migrate further and in greater numbers alongside NS-F10 cells than when cultured alone. Representative images taken from n=3 independent experiments. Scale bar = 200μm. All comparisons carried out by ANOVA, * p<0.05. **p<0.01. ***p<0.001. All graphs represent mean +/- standard deviation.

