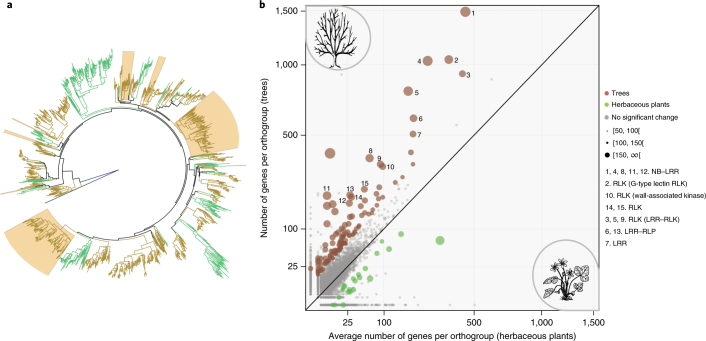
Fig. 4. Expanded gene families in trees.
a, Phylogeny of orthogroup 1 from Figs. 3d and 4b, established from the nucleotide-binding domains of 1,641 NB–LRR genes. Branches for trees and herbaceous species are shown in brown and green, respectively. Branches expanded in oak are shaded. For a higher resolution image see Supplementary Fig. 6. b, Scatter plot showing orthogroups expanded in trees and herbaceous plants (images from http://openclipart.org). Numbers in square brackets associated with circle sizes stand for -log(P-adjust), where P-adjust is the P-value of the binomial test adjusted for multiple testing.

