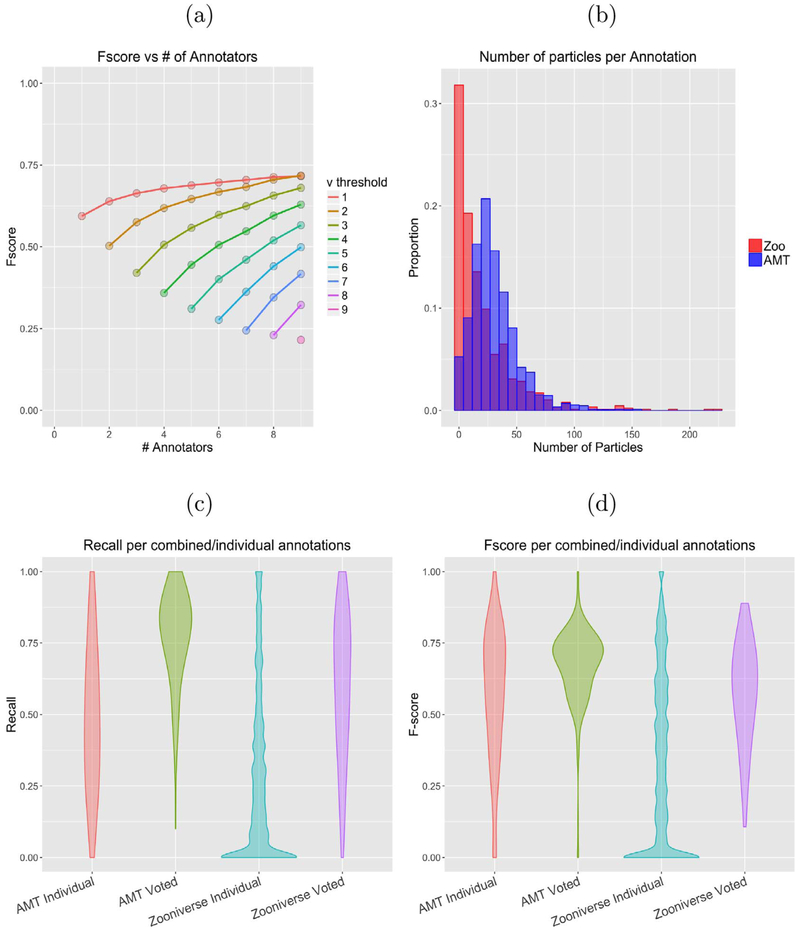
Fig. 2.
(a) Number of annotators vs performance, grouped by voting threshold. The top line represents union, while the bottom rung represents consensus, (b) Histogram showing distribuion of number of particles picked per person per Image for both AMT and Zoonlverse. Note peak at zero for Zooniverse, comprising ‘low-effort’ annotations. Recall (c) and F-score (d) of Individual classifications from Zoonlverse and AMT workers compared to gold standard. High numbers of low-quality, low-effort annotations from Zoonlverse workers result In peaks at 0 for recall and F-score.

