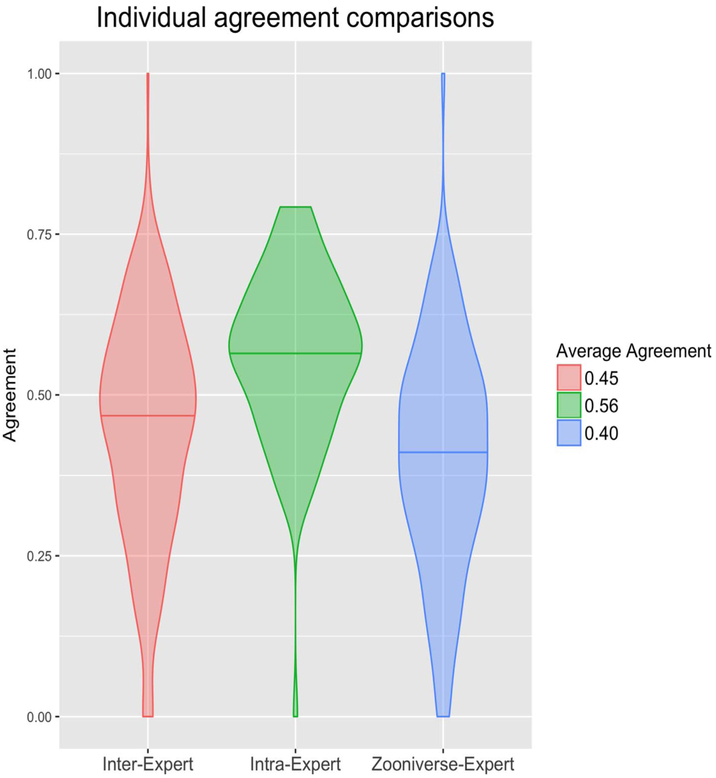
Fig. 3.
Violin plots of agreement, measured as the Jaccard index, for inter-expert, intra-expert, and crowd-expert comparisons. Standard deviations (σ) and number of comparisons (n) for each distribution are as follows: Inter-Expert: σ = 0.18, n = 227; Intra-Expert: σ = 0.13, n = 90; Zooniverse-Expert: σ = 0.18, n = 382.

