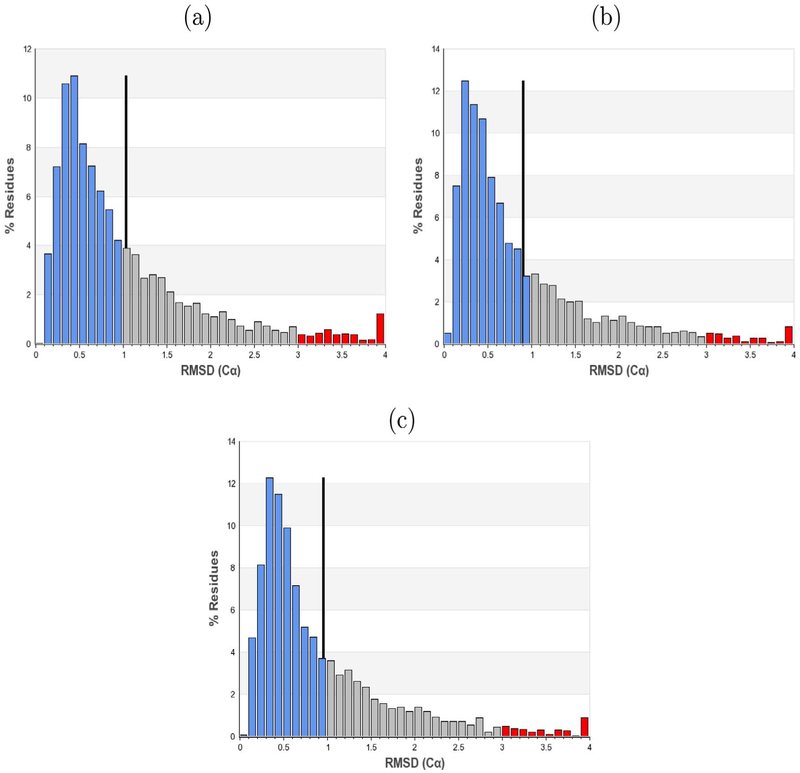
Fig. 6.
RMSD histograms of Cρ positions in the tenfold ensemble analysis. Blue, gray and red bars denote residues of low (<1), medium(>1, <3, and high (>3) convergence, respectively. The black line marks the mean of the distribution, (a) Ensemble based off refinement from Zooniverse volunteers, (b) Ensemble from automated template-based method data, (c) Ensemble from normalized automated template-based method data.

