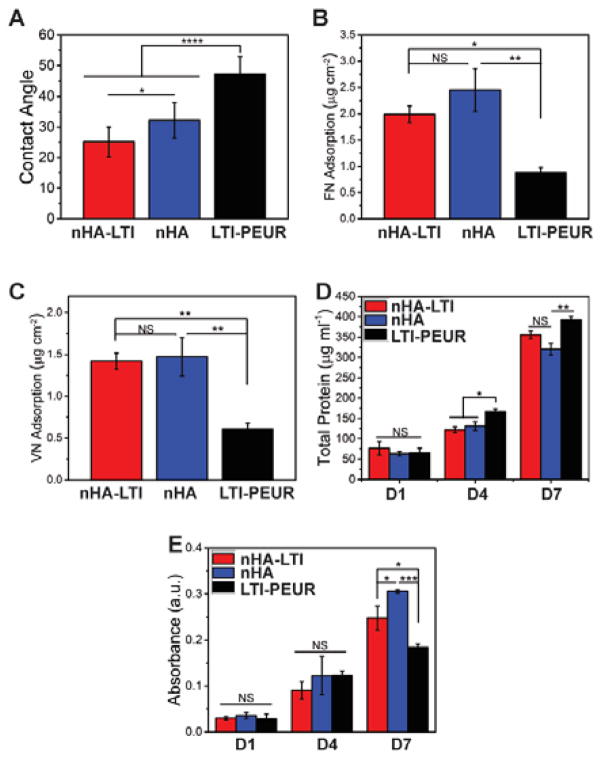
Figure 6.
Protein adsorption and osteoblast proliferation on nHA/PEUR nanocomposites. (A) Water contact angle measured for nHA-LTI and nHA nanocomposites and LTI-PEUR control. (B–C) Protein adsorption of (B) fibronectin and (C) vitronectin on nHA-LTI and nHA nanocomposites were significantly higher than that on LTI-PEUR. (D) Total protein measurement at day 1, 4 and 7 showed insignificant differences in proliferation of MC3T3 pre-osteoblast cells between nHA and nHA-LTI nanocomposites. Total protein was significantly higher on LTI-PEUR controls on days 4 and 7. (E) MTS assay showed significant differences between groups on day 7.

