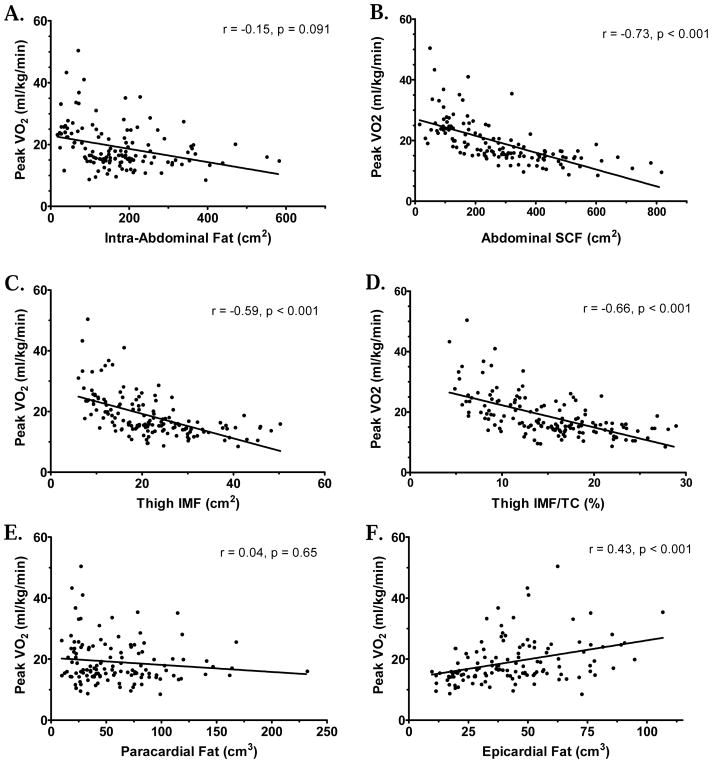
Figure 1. Peak VO2 (ml/kg/min) versus Regional Fat Measures.
Regression plots for baseline measures of Peak VO2 (ml/kg/min) versus (A) Intra-Abdominal Fat, (B) Abdominal SCF, (C) Thigh IMF, (D) Thigh IMF as Percent of Thigh Compartment (TC), (E) Paracardial Fat, (F) Epicardial Fat. Similar results were found for non-indexed Peak VO2 (ml/min) as well. Regional fat measures obtained using MRI. Thigh compartment calculated as Intermuscular Fat+Skeletal Muscle+Bone. Spearman r and p values additionally included for reference.

