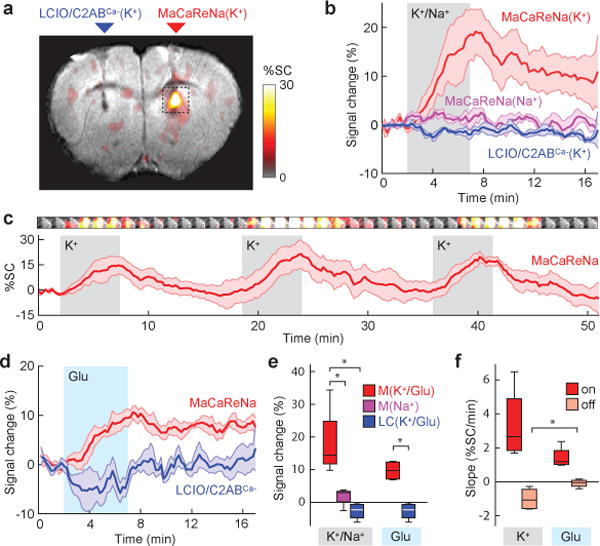
Figure 3. MaCaReNas report dynamic Ca2+ fluctuations in living rat brains.

(a) K+ infusion (100 mM, 0.12 μL/min) induces molecular fMRI signal increases in the presence of MaCaReNa sensors (right) but not calcium-insensitive LCIO/C2ABCa− controls (left). Signal change amplitudes indicated by the color scale are superimposed on a grayscale anatomical image for a representative rat (out of 4). (b) Signal change time courses near areas of contrast agent delivery show that K+ infusion (gray shading) in the presence of MaCaReNas induces clear responses (red trace), while 100 mM Na+ infusion in the presence of MaCaReNas (purple trace) and K+ infusion in the presence of LCIO/C2ABCa− controls (blue trace) barely affects MRI signal. (c) Average time course (red trace) of three consecutive K+ stimuli (gray shading) shows reproducibility of MaCaReNa responses (n = 4). Images above the trace correspond to dotted box in (a) and illustrate mean signal change from pre-stimulus baseline as a function of time (1.4 min average per image frame). (d) Dynamic signal changes in response to brain stimulation by glutamate infusion (1 mM, 0.12 μL/min) in the presence of MaCaReNas (red trace) and in the presence of LCIO/C2ABCa− (blue trace). (e) Average signal changes (response at stimulus offset time, minus baseline) measured under each of the stimulation conditions in (b) and (d). MaCaReNas (M) in the presence of K+ or glutamate (Glu) were significantly different from LCIO/C2ABCa− controls (LC) and MaCaReNas in the presence of Na+ (p ≤ 0.027 and n = 4 for all groups). (f) Comparison of slopes for response onset (dark red) and recovery (light red) for K+ and glutamate stimulation. Recovery slopes were significantly less negative for glutamate stimulation, indicative of longer lasting [Ca2+]o depression (p = 0.04, n = 4). All shading indicates SEM; box plots indicate median (center line), first quartiles (box edges), and second quartiles (whiskers).
