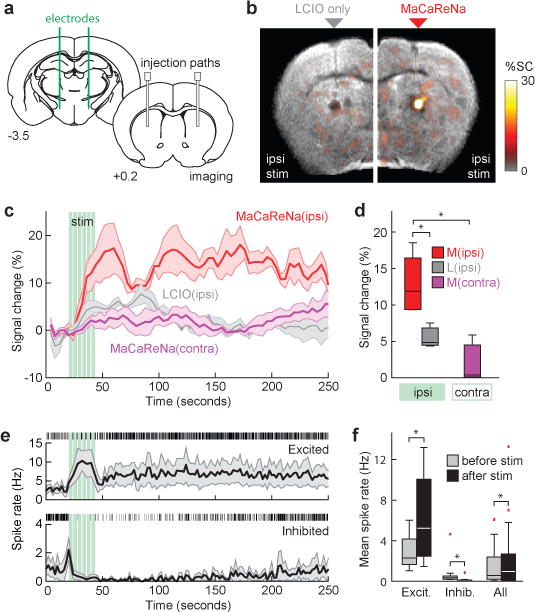
Figure 4. MaCaReNas report striatal responses to medial forebrain stimulation.

(a) Schematic showing locations of bilateral MFB electrode implantation and striatal MacaReNa infusion; distance from bregma is noted below each brain section34. (b) Ipsilateral MFB stimulation induces MRI signal changes in the presence of MaCaReNas (right) but not control LCIO particles (left). Mean signal changes from four animals shown in color, superimposed over a T2-weighted scan. (c) Average response to ipsilateral (red) or contralateral (purple) MFB stimulation in the presence of MaCaReNas, and response to ipsilateral stimulation in the presence of control LCIO particles (gray). Stimulus pulse trains indicated by green vertical lines; shaded regions indicate SEM over multiple animals (n = 4 for MaCaReNas, n = 3 for controls). (d) Mean signal changes during the immediate post-stimulus interval for all conditions. MaCaReNas with ipsilateral stimulation were significantly different from both the contralateral stimulation condition and with the LCIO control result (p < 0.05). (e) Single unit recordings in dorsal striatum using the MFB stimulus paradigm. Prolonged post-stimulus excitation (top) or depression (bottom) of subpopulations of units parallels the molecular fMRI time course. Mean spike rates shown with SEM over units (shading); representative rasters shown above each time course. (f) Mean spike rates before vs. after MFB stimulation for excited units (n = 9), inhibited units (n = 12), and all units (n = 38) recorded from two animals. All differences were significant with p < 0.0001 when comparing 30 two-second bins before vs. after stimulation. Box plots indicate median (center line), first quartiles (box edges), and second quartiles (whiskers); red tics denote outliers.
