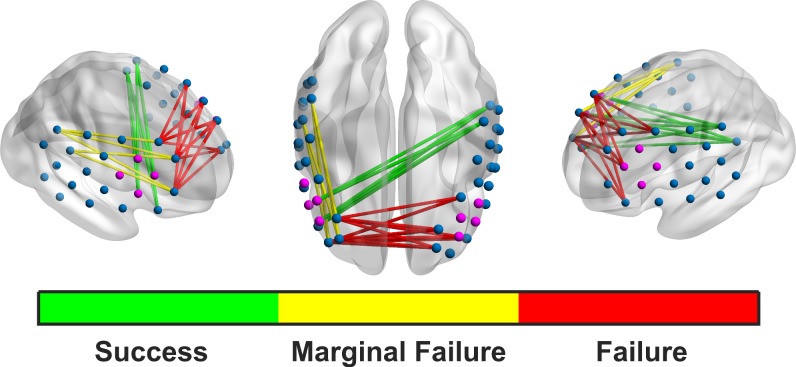
Fig 4. Significant ROI-based connectivity plots.
The green Success FC occurs during successful rests and trials and is between the right IFG (making up a considerable part of the feedback channels) and left parietal lobe. The red Failure FC is between the left and right dlPFC, and is stronger on failed trials and rests. Connectivity between the right dlPFC and right parietal lobe is marginally stronger during failed rests and trials than successful ones.

